System Management
Announcement Management
When a user logs into the system, if announcements exist, a popup displays the announcement information.

Click "Next" to view the next announcement, "Previous" to view the previous one, or "Skip" to close the current window. Unviewed announcements will still appear in a popup upon the next login. Clicking the "x" close button in the upper right corner of the popup has the same effect as the "Skip" button.
Clicking the small bell icon in the upper right corner of the system displays the current list of system announcements.

Clicking an announcement subject allows you to view the announcement details.

Message Center
When a regular user logs into the platform, click "System Management > Message Center" or the Message Center icon in the upper right corner to open the Message Center page.

- Displays the list of all unread messages receivable by the current regular user, including: Type (Alert Notification), Content (Alert Information, Notification Information), Status (Unread), Arrival Time, and Read Time. Message display and query are controlled uniformly by the "Query" button.
- For alerts, only severe alert information is displayed in the messages.
- Messages can be marked as read in bulk or deleted in batch.
- Use the dropdown to filter messages by read, unread, or all status; filter by message type; and enter text in the input box for fuzzy search of message content.
Log Management
The platform provides log management functionality. After logging in, regular users can access the Log Management interface by clicking System Management > Log Management.
Operation Logs
Function Description: Regular users can access System Management > Log Management > Operation Logs. This page provides viewing and export functions for system operation logs, as shown below. System logs include user login, logout, update, delete, and create operations, recording details such as operator, operation time, user group, terminal IP, operation object, functional module, data ID, and cluster name. This facilitates regular users in viewing operation records and tracing operation history.
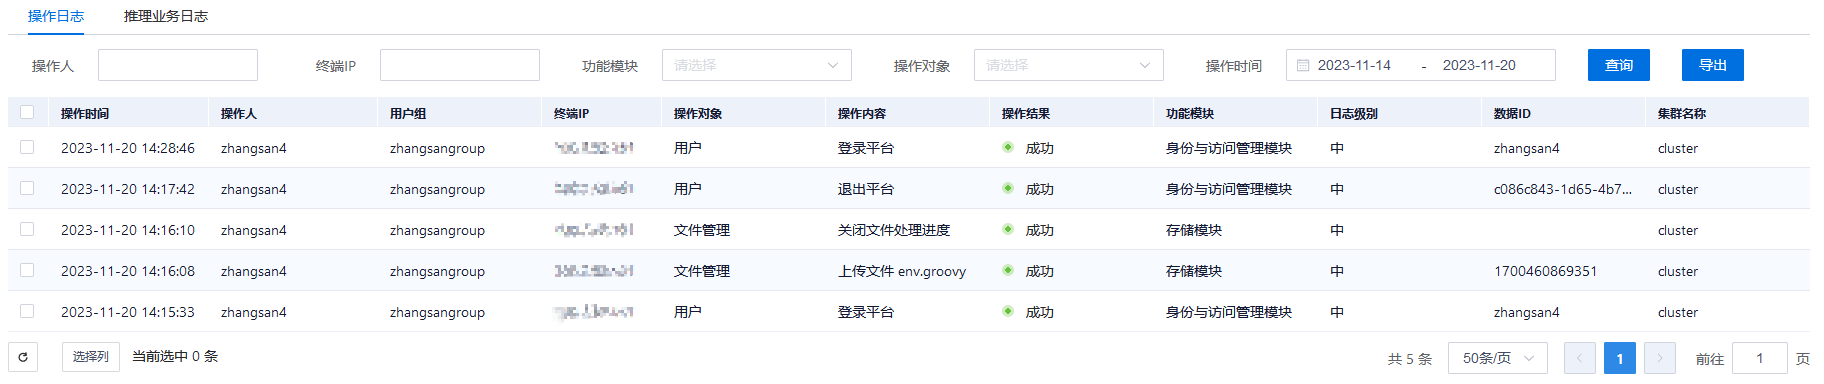
- Log Query: Regular users can perform fuzzy queries based on operator and terminal IP, and filter by operation time, operation object, and functional module. Enter the operator and terminal IP, select the operation time range, operation object, and functional module, then click the Query button. The list displays data matching the conditions. Only log data from the past six months is supported.
- Log Export: After selecting query conditions, click the Export button to export the queried log files in txt format.
- Regular users can only view their own operation logs.
Note: Both query and export operations are limited to a time range of six months.
Inference Service Logs
Available when the business scope is Training/Inference or Inference.
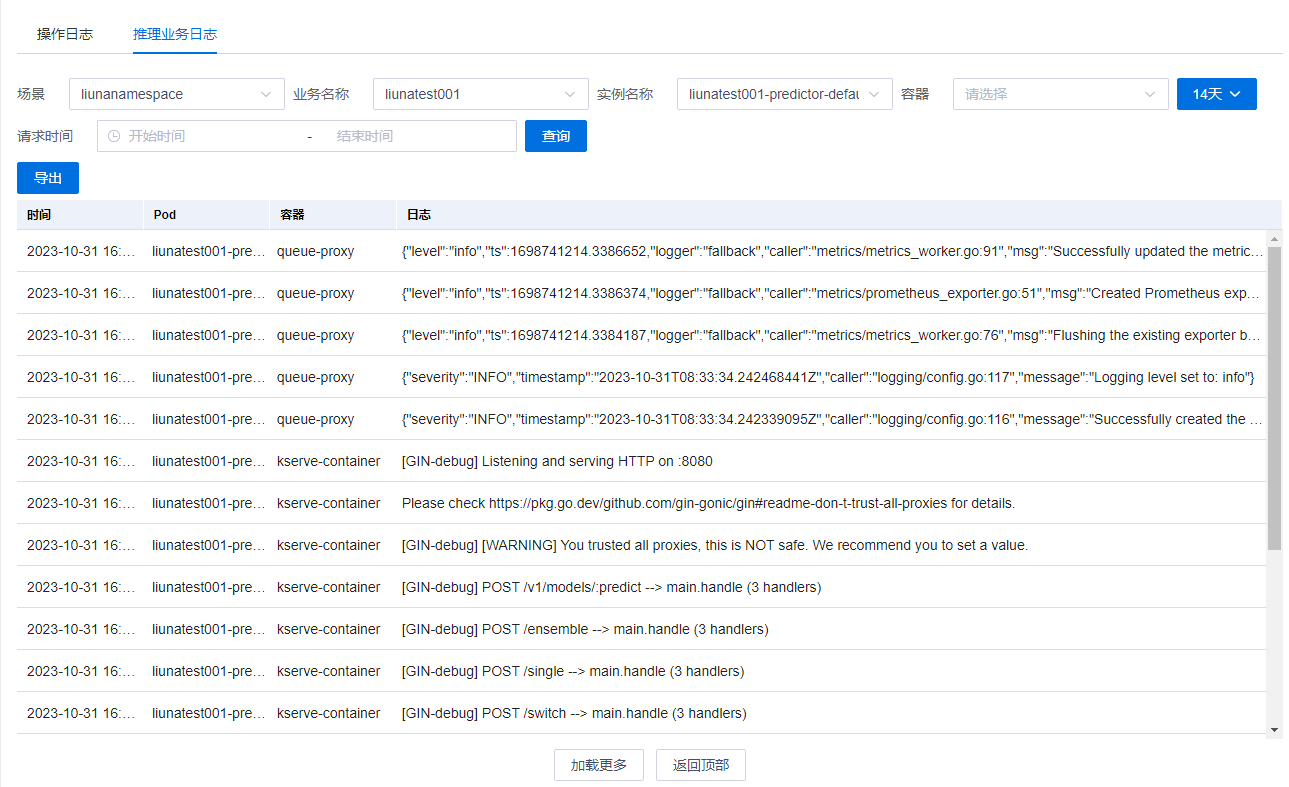
Navigate to System Management > Log Management > Inference Service Logs to view logs for services with normal running status, including model deployment, application deployment, native deployment, and Helm deployment. Services with abnormal status are not displayed or available in the dropdown. Query conditions for Inference Service Logs include: Scenario, Business Name, Instance Name, Container, and Time. Users can customize the time range or use quick options: 5 minutes, 15 minutes, 30 minutes, 1 hour, 3 hours, 6 hours, 12 hours, 1 day, 7 days, or 14 days. Click Export to download the queried logs. The log list includes:
| Name | Description |
|---|---|
| Time | Log Timestamp |
| Pod | Pod Generating the Log |
| Container | Container within the Pod Generating the Log |
| Log | Log Content |
| Load More | Load More Logs |
| Back to Top | Return to the Top of the Logs |
Approval Management
The platform provides approval management functionality. After logging in, regular users can access the Approval Management interface by clicking System Management > Approval Management. Approval Management includes one module: Approval List.
Approval List
Regular users can view their submitted approval requests in the Approval List interface. The list includes: ID, Business Name, Business Operation, Applicant Role, Approver, Approval Status, Approval Comments, Execution Result, Application Time, Approval Time, and Actions.
The Approval List supports sorting by approval status, with default sorting by application time.
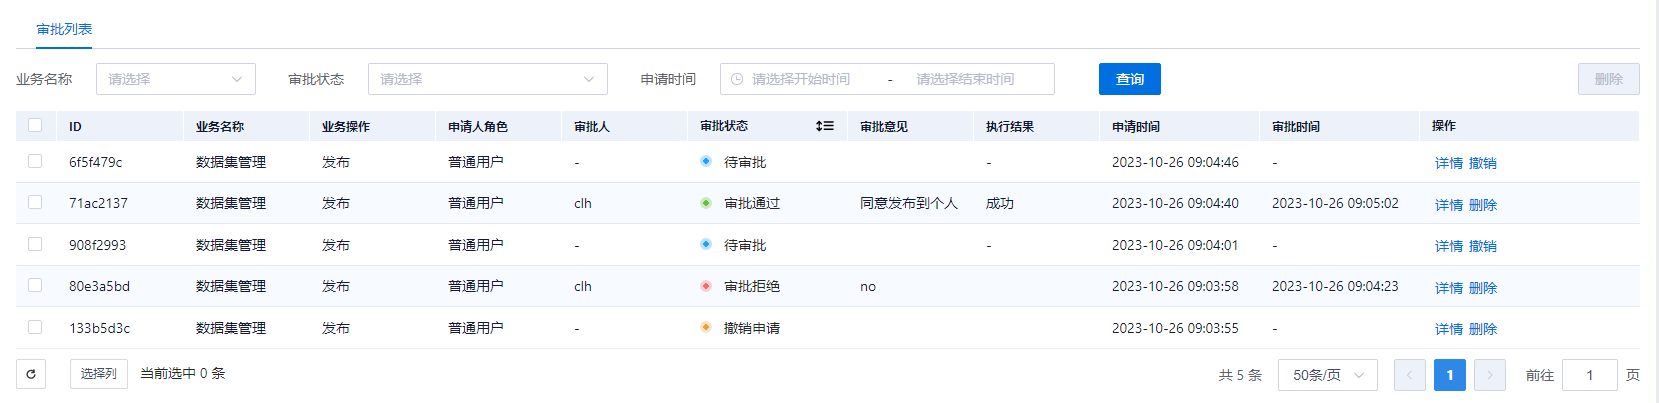
Supports querying data by Business Name, Approval Status, and Application Time.
| Query Conditions | Description |
|---|---|
| Business Name | Select exact match for Business Name from the dropdown. |
| Approval Status | Select one or more exact matches for Approval Status from the dropdown. |
| Application Time | Select exact match within the start and end time range. |
Click the Query button to display approval requests matching the query conditions in the Approval List.
Details
Regular users can click Details for any approval request in the Approval List to view specific information about the business operation.

Revoke
Regular users can revoke approval requests they submitted that are in the Pending Approval status. After revocation, the request status changes to Revoked.
Delete
Regular users can delete approval requests in the approval list that are not in the pending approval status. Batch deletion is supported. Deleted approval requests will no longer appear in the approval list.
Service Invocation Data
Available when the business scope is Training/Inference or Inference.
Statistics on the total number of services using the service invocation data feature
Navigate to System Management > Service Invocation Data to view the total number of services using the service invocation data feature, including natively deployed services, general models, and application deployments.

When using the service invocation data feature, general models and application deployments must select Enable Logging during deployment. Natively deployed services must add annotations and labels related to rrcollector. An example of native deployment is as follows:

Storage Space Usage Statistics
Navigate to System Management > Service Invocation Data to view the storage space occupied by data in service invocation data by scenario. The unit of storage space is MB.

Backflow Data
Navigate to System Management > Service Invocation Data to view the backflow data list.
Query Request/Response Data
Query: Users can filter service request information by scenario, service name, processing duration, status (status values can be preset or manually entered; manually entered values support exact matching only, except for preset values), and request time. The table displays the following information:
| Name | Description |
|---|---|
| Scenario | Scenario where the service is located |
| Service Name | Service Name |
| Request Time | Time when the service was requested |
| Request Content | (Bytes) Request body size in bytes |
| Response Time | Service response time |
| Response Content | (Bytes) Response body size in bytes |
| Status | Response Status |
| Processing Duration | Processing duration for this request |
| Actions | Delete Button |
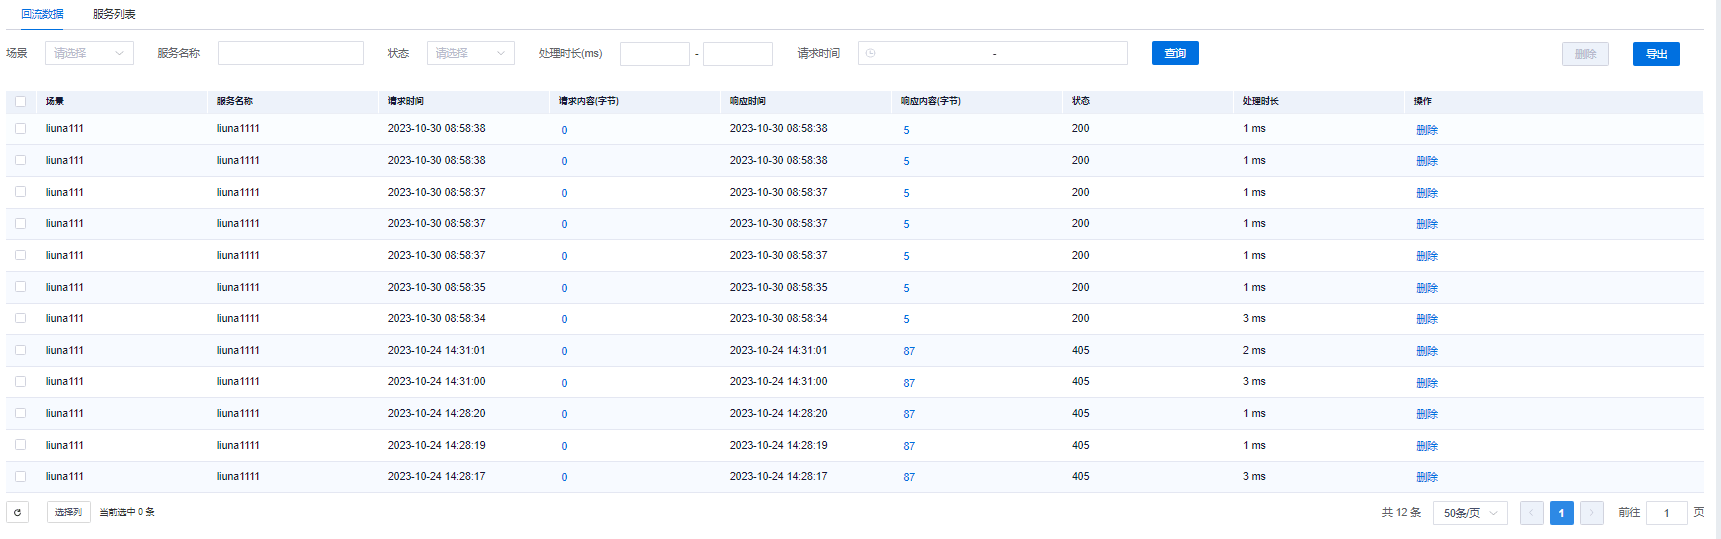
View Specific Request/Response Data: Click the byte count of the request content/response content to view the text and file data of the request/response. Text data is displayed directly, while file data needs to be downloaded for viewing.

Delete Data
Click the delete button next to each data entry in the list to delete the data.

Select the checkboxes of the data entries to be deleted in the list, then click the delete button at the top of the list to batch delete the data.

Export Data
File Generation: Query the data, click the export button to start generating the export file. Restrictions: The file size must not exceed 1GB; if it exceeds 1GB, generation will fail. Only one file can be generated simultaneously by the same user. If generation is successful, the file name will be displayed after the export button, allowing the next step of downloading. If export fails, the reason for failure will be displayed after the export button.
File Download: Click the download button next to the file name to download the export file.
File Retention Mechanism: Generated files are retained for only one day. You can also manually delete them by clicking the delete button next to the file name.

Service List
Navigate to System Management > Service Invocation Data to view the list of services using the service invocation data feature.
Query Service Invocation Data Service List
Users can filter service information by scenario, service name, and creation time. The table displays the following information:
| Name | Description |
|---|---|
| Scenario | Scenario where the service is located |
| Service Name | Service Name |
| Creation Time | Service creation time |
| Creator | Service Creator |
| Data Backflow Address | The backflow address is the data forwarding address; request response data generated by this service will be forwarded to the backflow address. |
| Actions | View Backflow Data and Edit Button |
 |
View Associated Backflow Data
Click the "View Backflow Data" button in the operation column of each service to navigate to the backflow data page, which displays the backflow data for that service.
Modify Data Backflow Address
Click the "Modify" button in the operation column of each service and enter the corresponding backflow address. Once the backflow address is added, the configured address will receive requests and response data from the corresponding service.

API Authorization
Available when the business scope is Training/Inference or Inference.
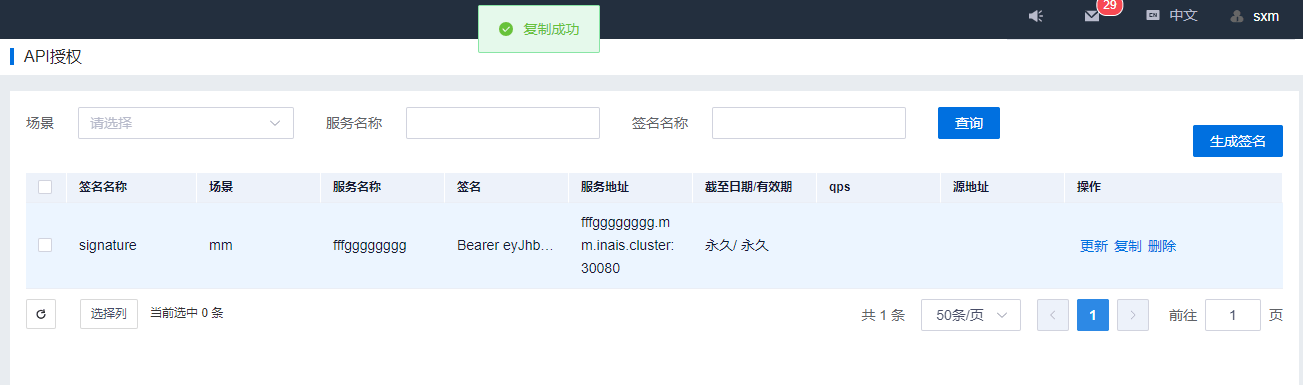
Regular users can create, update, query, and delete API authorization information.
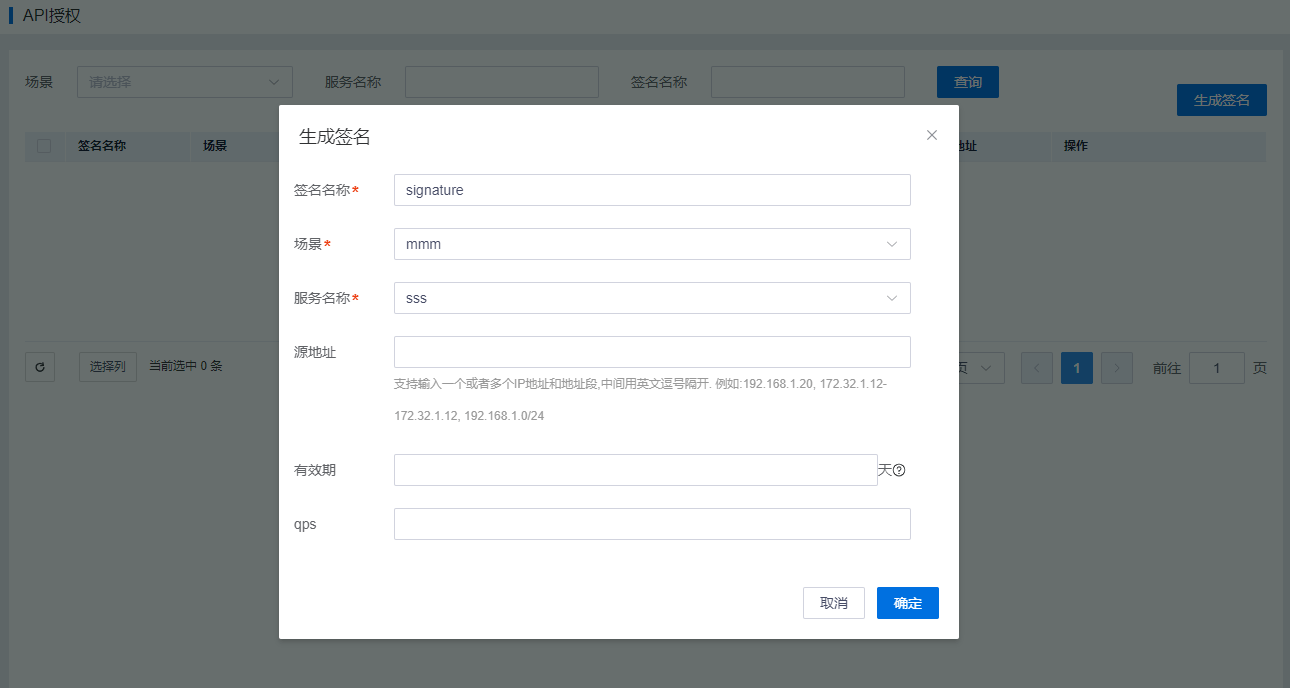
Create Signature
Regular users can select a scenario and service name, and enter the expiration date, QPS, source address, and signature name to create API authorization.
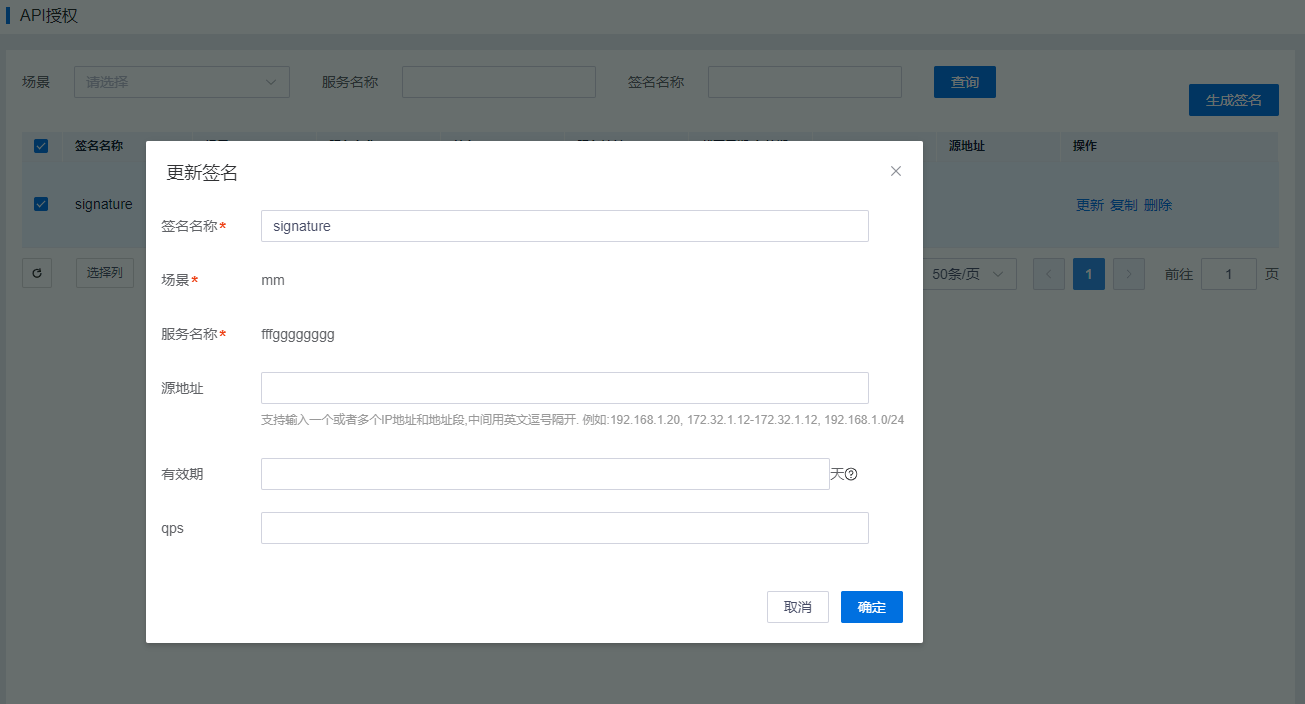
Update Signature
Regular users can select an API authorization entry, click "Update", and enter the expiration date, QPS, source address, and signature name to update the API authorization.
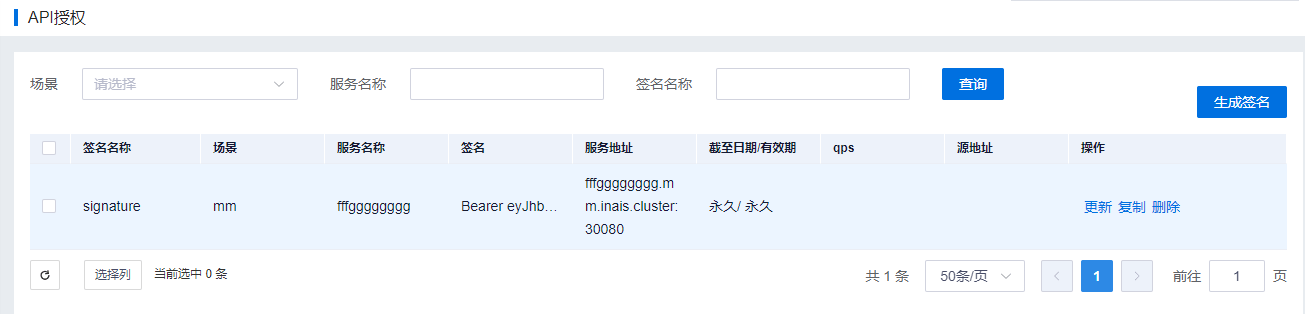
Query Signature
Regular users can query API authorization information by scenario, service name, and signature name.
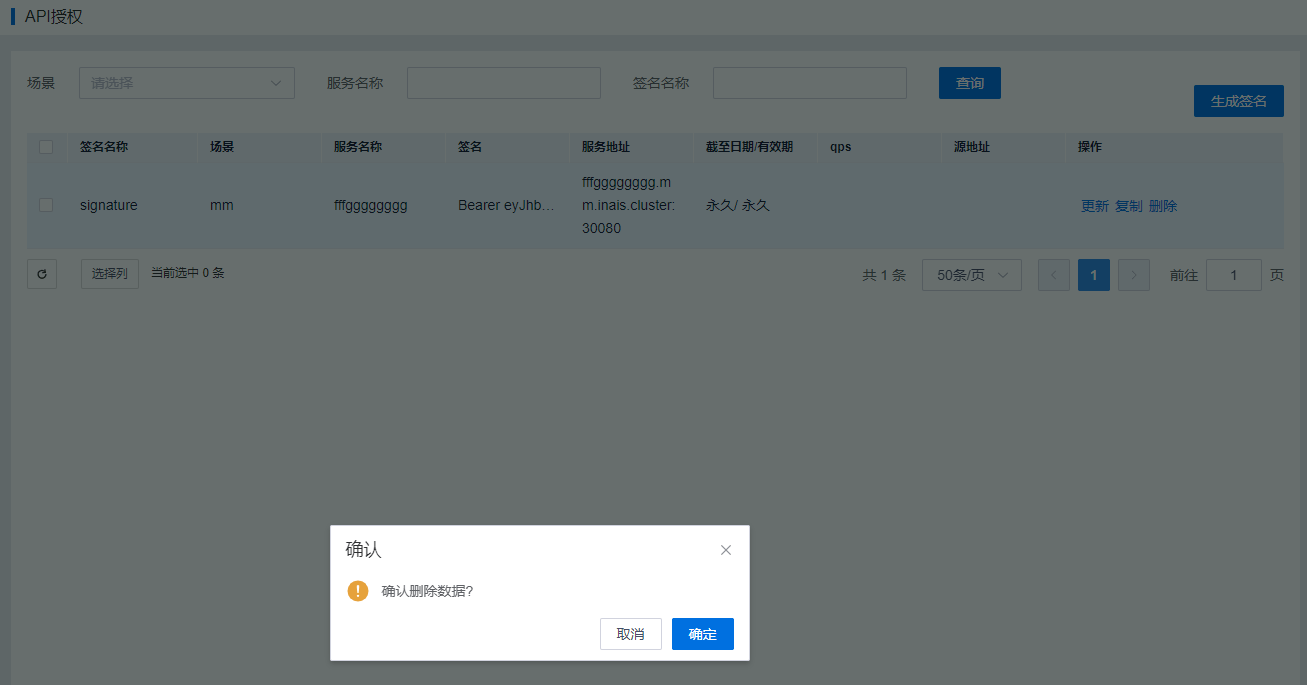
Delete Signature
Regular users can select an API authorization entry, click "Delete", and remove the API authorization.
Copy Signature
Group administrators can select an API authorization entry, click "Copy", and duplicate the API signature.
AK/SK Signature Authentication
Feature Description: Users with development permissions enabled can refresh the SK, view the SK, and set the SK validity period.
Refresh SK Information: Refreshes the SK information for AK/SK signature authentication. If the secondary authentication switch is enabled, secondary authentication is required before refreshing the SK information.
View SK Information: Displays the plaintext SK information for AK/SK signature authentication. If the secondary authentication switch is enabled, secondary authentication is required before displaying the plaintext SK information.
SK Validity Period: After enabling development permissions for the first time, the default validity period is 7 days. It can be set to permanent or a specific expiration date can be selected.
