Visualization Features
The development environment and the AIStation training management module provide visualization features for mainstream framework models. The following describes how to use these features:
1. Training Management
In the training management module, single-machine and distributed training jobs support visualization.
The Caffe framework supports Netscope network structure visualization and Caffe training process visualization;
Tensorflow, Mxnet, and Pytorch frameworks implement visualization using the TensorBoard tool; the PaddlePaddle framework uses the VisualDL tool.
View during the training job or after completion by clicking the Visualization button to enter the visualization page. The following introduces the visualization features using a completed job as an example.
2. Caffe Visualization
Caffe Network Structure Visualization
Visualization Task - Create
Click the Visualization button to open the Netscope tab and start creating a Caffe visualization task.
Netscope
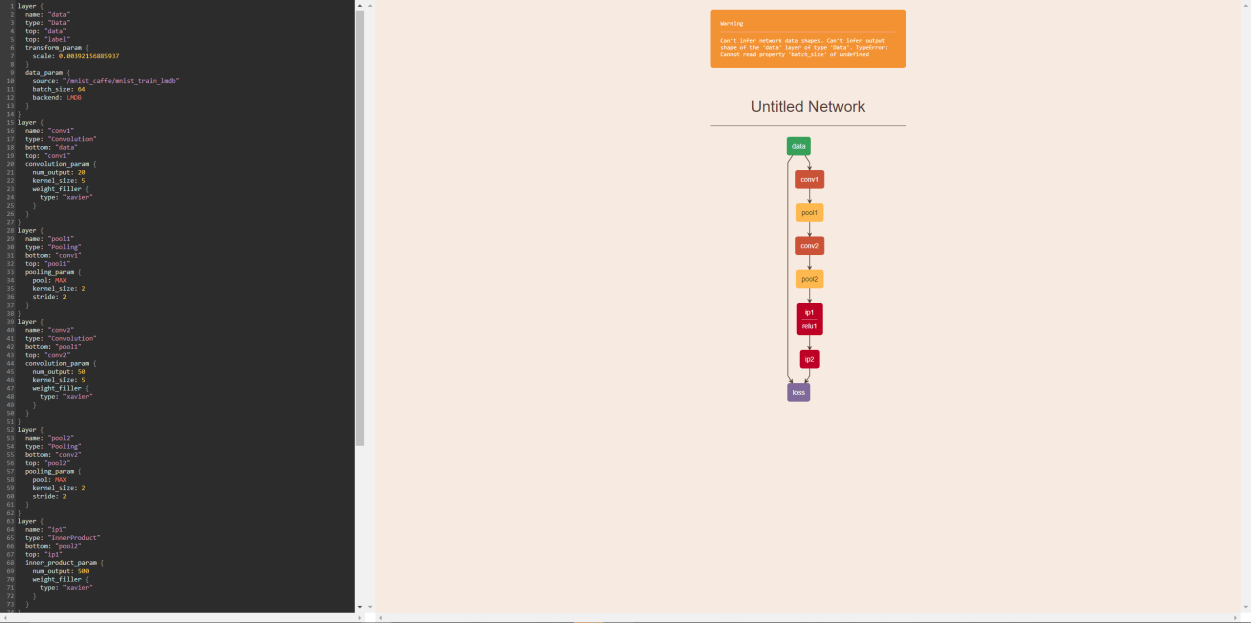
Enter the file management system, open the Caffe network structure file (train-lenet.prototxt), and copy the entire text; paste the text into the left input box, press Shift+Enter to generate the network structure.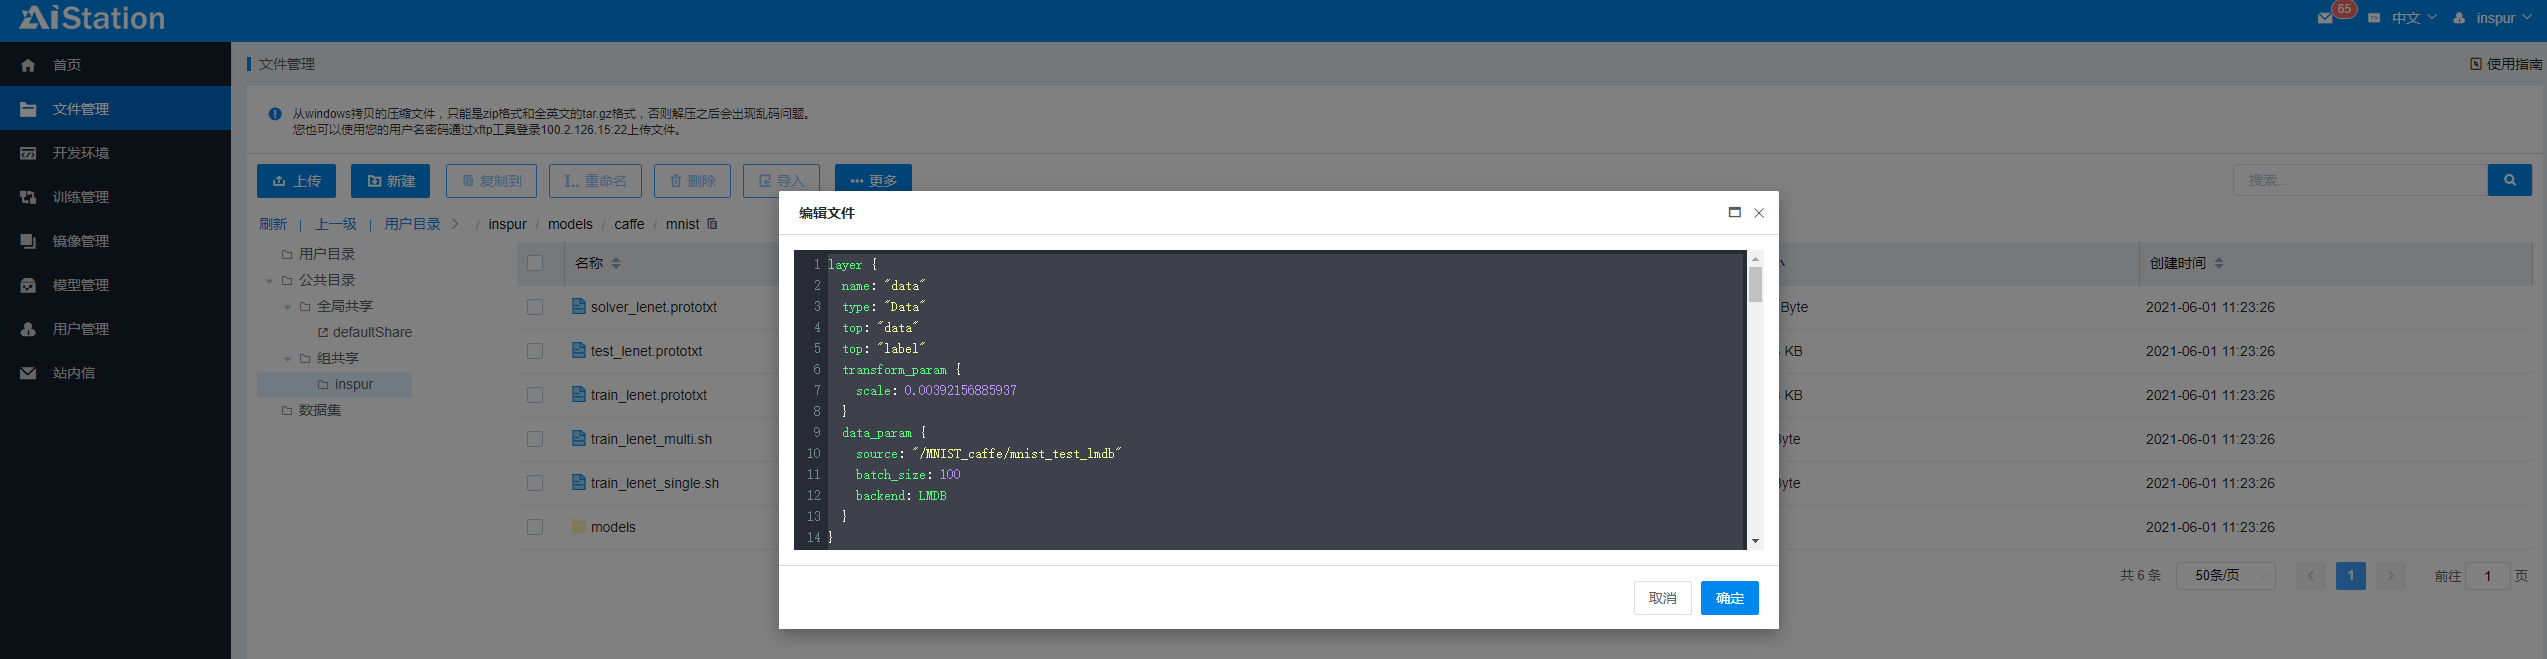
Caffe Training Process Visualization
Visualizing Tasks - Creation
Click the Training Process Visualization button to start creating Caffe training process visualization.
Visualization
The training process visualization window pops up, displaying training time, loss rate, and learning rate.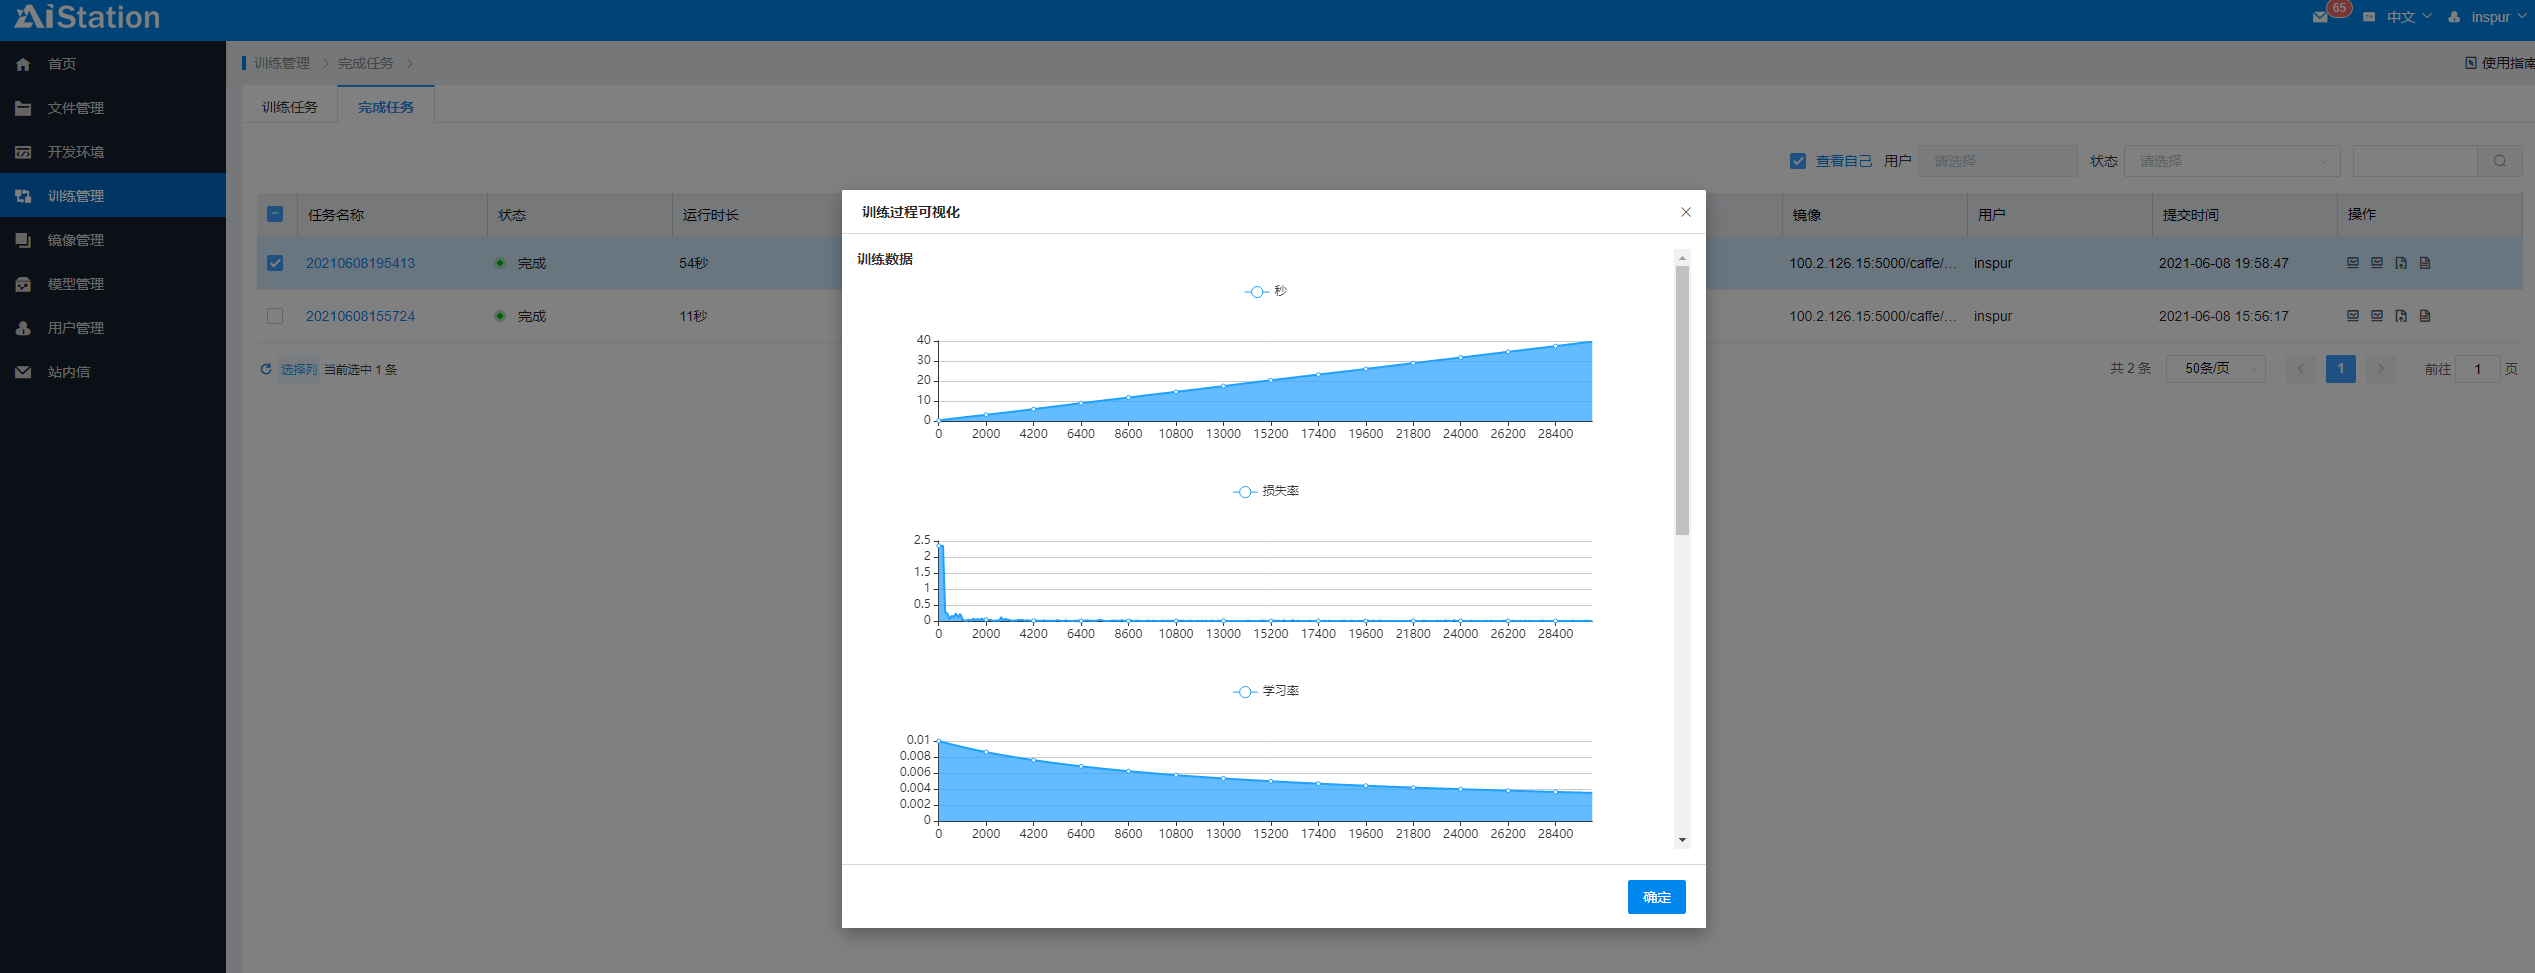
2. TensorFlow Visualization
Visualization Task - Create
Click the Visualization button to start creating a TensorFlow visualization task.
Select the startup folder
Click the visualization folder you want to open.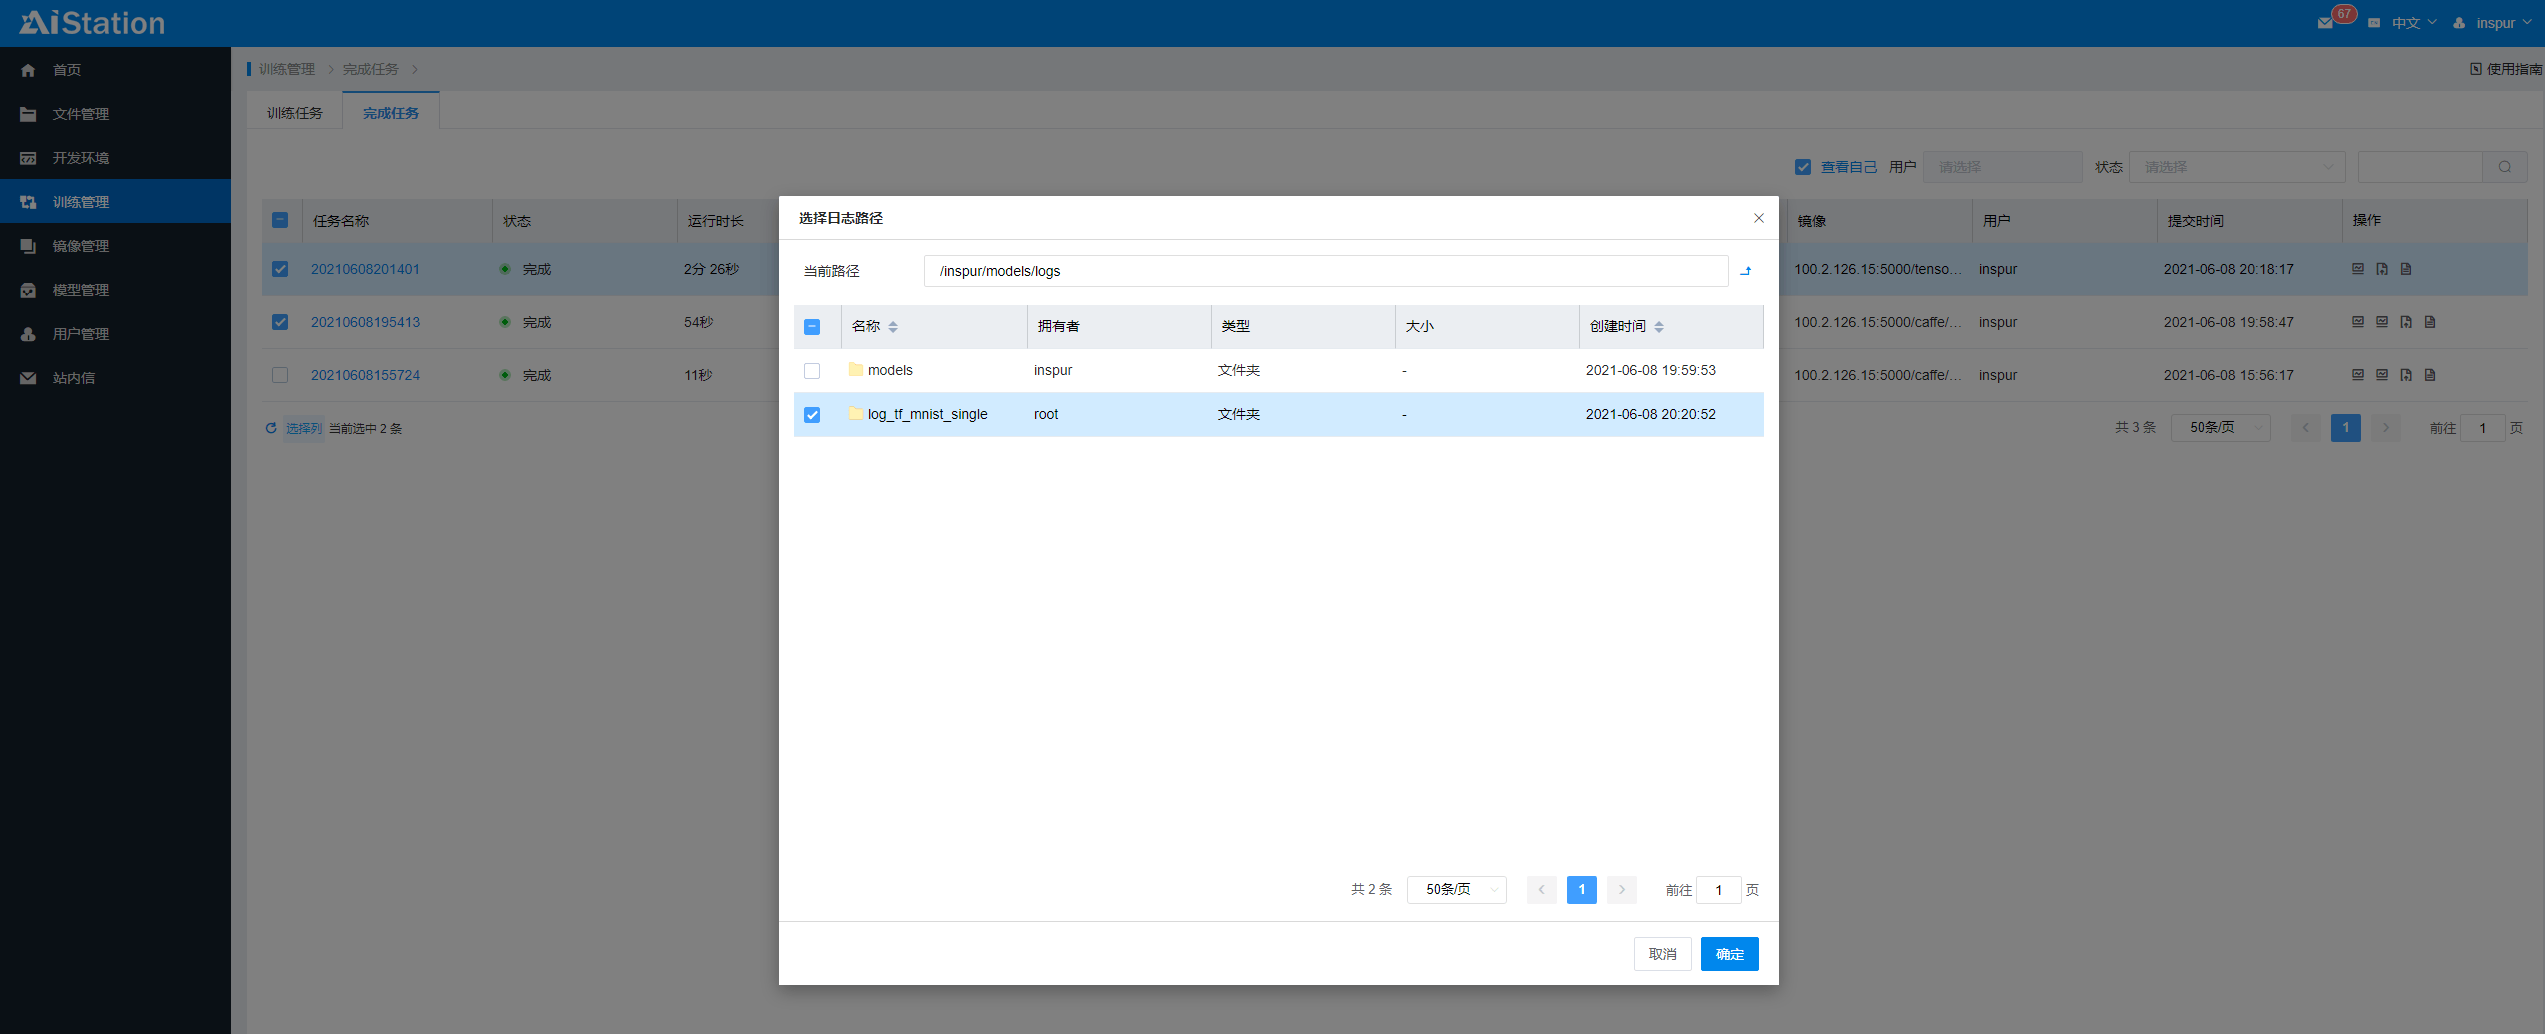
TensorBoard
Open the TensorBoard tab to display TensorFlow visualization information.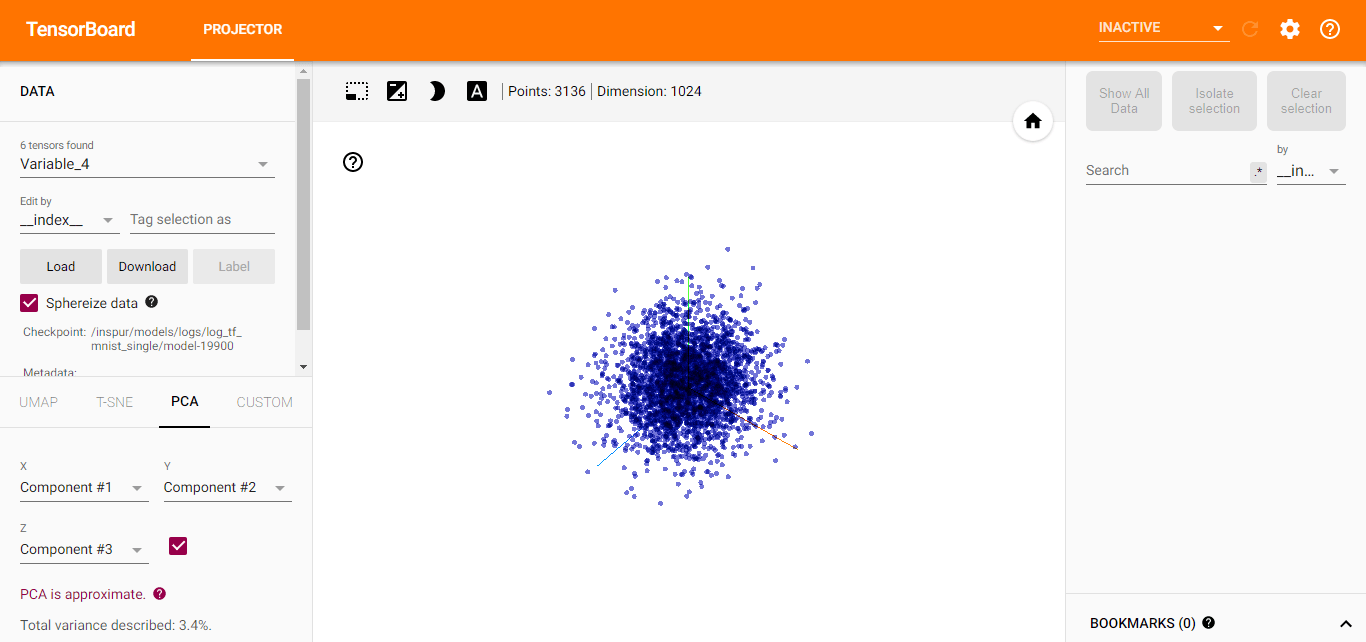
For task visualization in other frameworks, refer to the "TensorFlow Visualization" section.
3. Development Environment
In the development environment module, when the created development environment is running, you can select the corresponding visualization tools, as shown below: In the development environment, AIStation provides these three visualization tools by default. When using the TensorBoard tool, please select the correct log file; the usage of the Netscope visualization tool is the same as training management, refer to the above content.
The Visdom tool is for visualizing PyTorch framework tasks. When using this visualization tool, please ensure that the created development environment is based on a PyTorch framework container image. For specific usage, please refer to the following introduction:
- Example demo.py file path: "/[user-name]/visualization/visdom/demo.py";
- Create a development environment based on a PyTorch framework container image;
- Open the Visdom visualization tool;
- Modify the hostname and port number in the demo.py file to match the webpage opened by the Visdom visualization tool;
- Execute the python demo.py command in the development environment shell terminal to run the demo example, and you can view the visualization of this demo on the page opened by Visdom.