Business Management
Development Environment
"Business Management > Development Environment" is available when the business scope is Training & Inference or Training
Development Environment List
Click Development Environment in the left navigation pane to open the development environment list page. The top of the page displays summary information for development environments, the list displays basic information for each development environment, and the right side of the list displays related action buttons. You can select multiple development environments and click the Delete button in the upper-right corner to delete them in batch, or click the dropdown menu in the Actions column for any development environment and select Delete, as shown below:
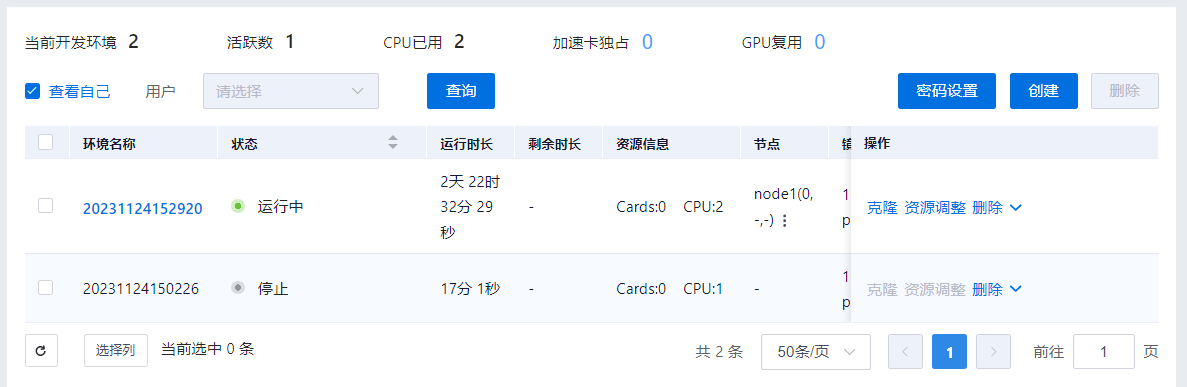
Click the Set Password button at the top to set the shell password for the development environment. Random password (default) and fixed password are supported.
Create Development Environment
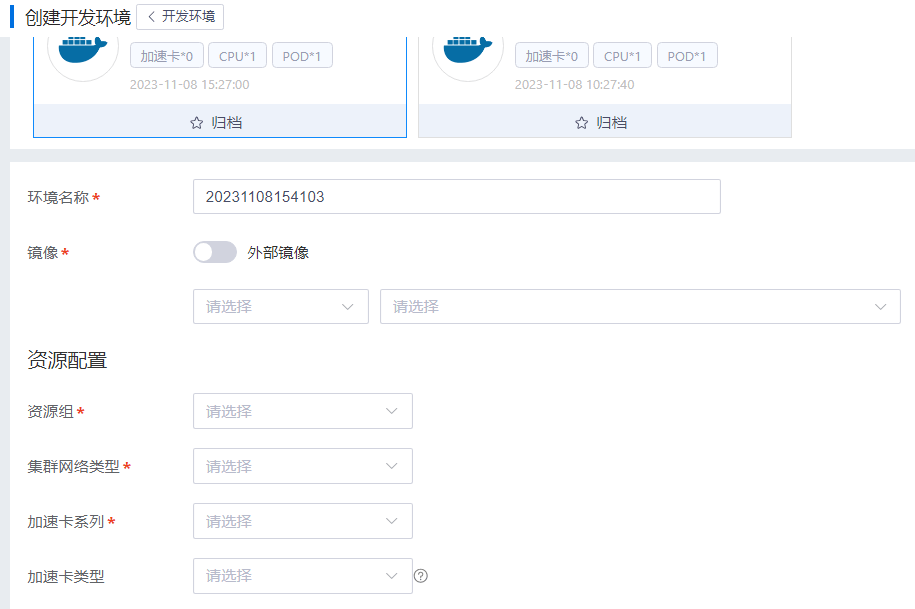
Click the Create button on the page to create a development environment. You can create a development environment from scratch (currently supporting Caffe, TensorFlow, Mxnet, Pytorch, PaddlePaddle, and other frameworks) or based on a historical development environment. Historical development environments can be archived and unarchived; archived environments are displayed with higher priority. Users can select resource groups, resource configurations, data, models, environment variables, and other information, and can also specify nodes, as shown below:
Development Environment Details
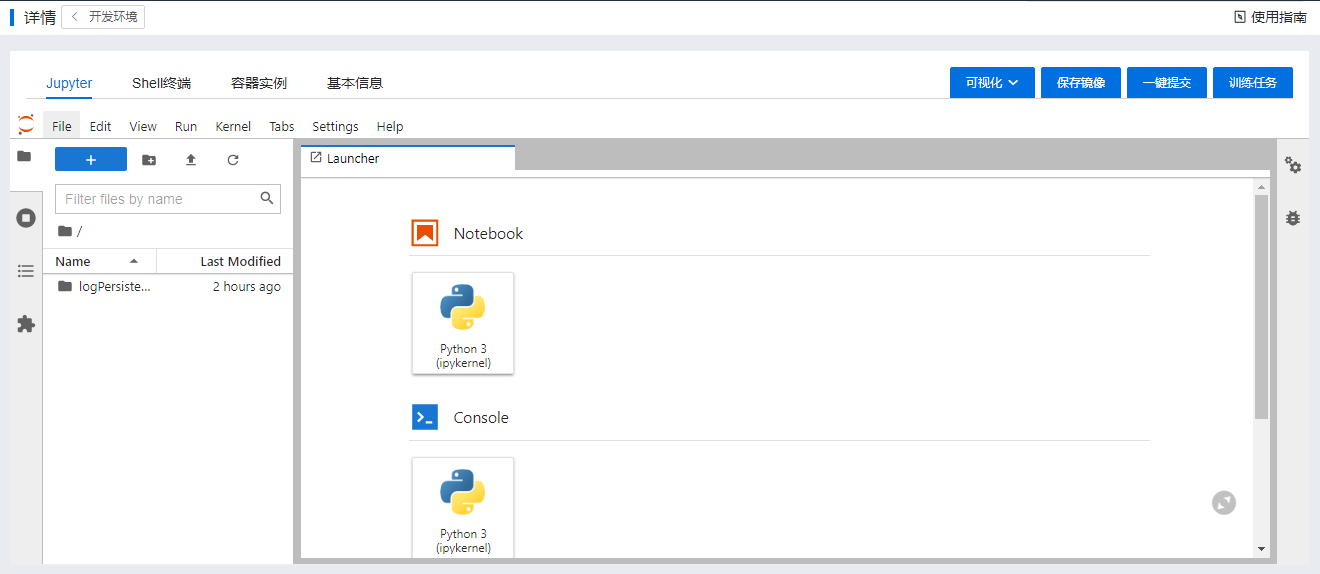
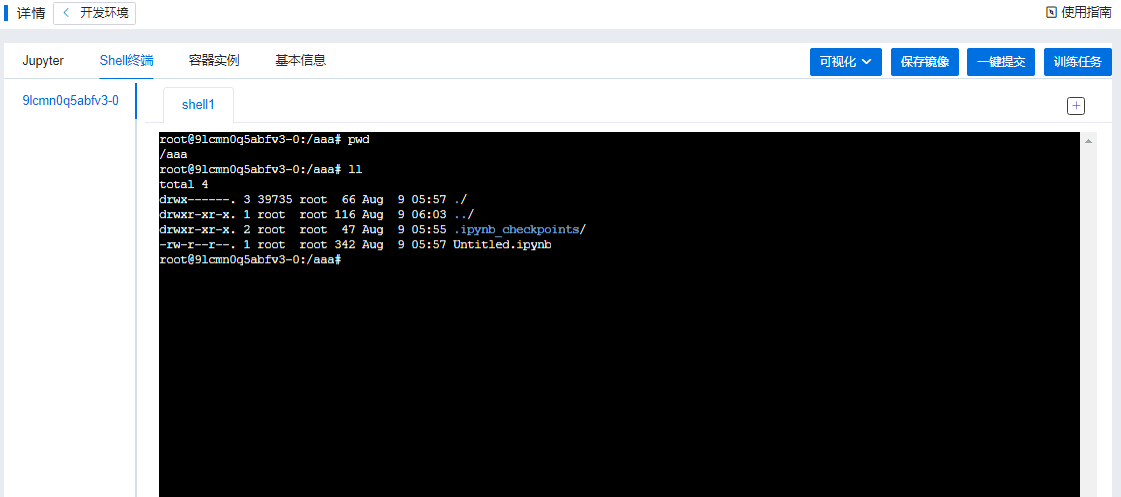
In the development environment list, click the name of a running development environment to view its details. On the details page, you can use Jupyter to edit and debug scripts, connect to the environment using a web shell terminal (supporting multiple windows), view the container instance list and performance monitoring within the container instance, and view basic information. Visualization (currently supporting TensorBoard, Visdom, Netscope), saving the current development environment as a container image, one-click submission of training jobs, and viewing training jobs are also supported, as shown below:
Jupyter:
Shell Terminal:
Container Instances:
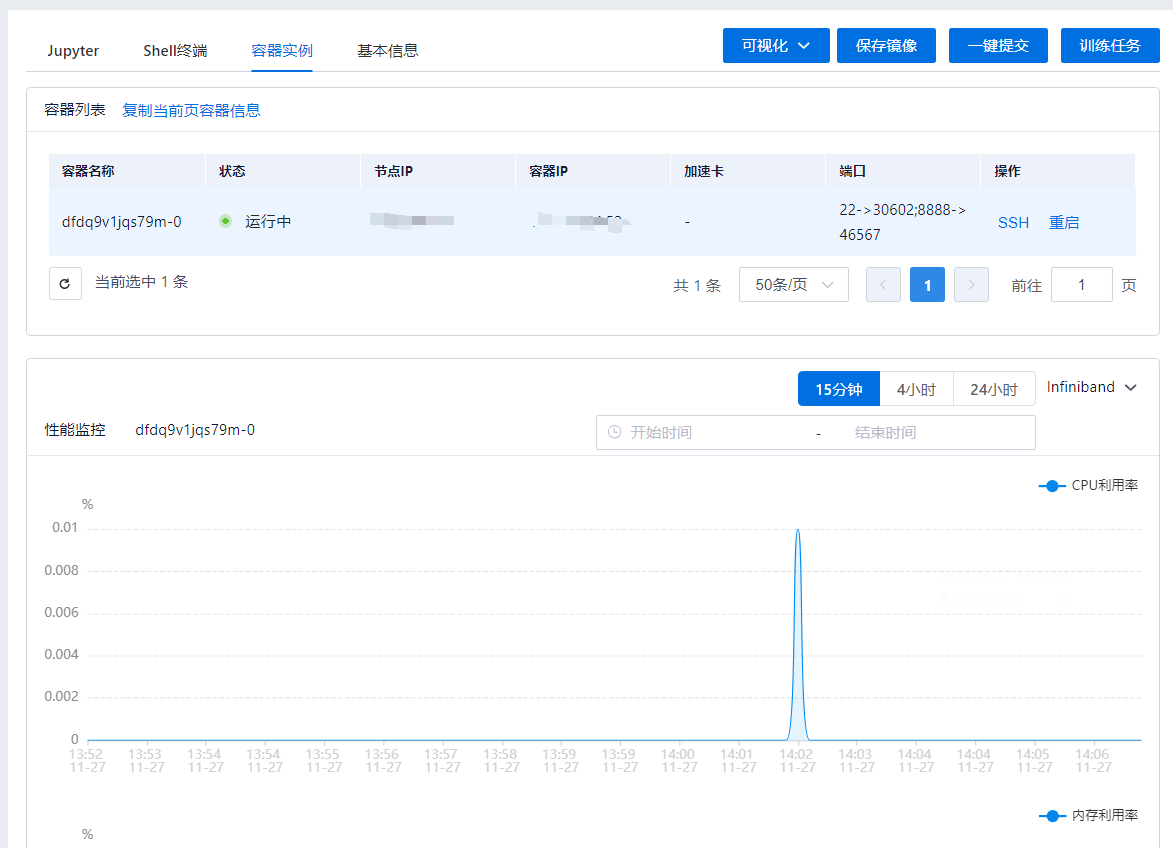
The container instance list includes: Name, Status, Accelerator, Node, IP, Port, and Actions columns.
| Feature | Description |
|---|---|
| Container List - Copy Current Page Container Information | This feature allows you to copy the Pod Name, Node IP, and Container IP information for all containers in the current container list (if paginated, you must switch pages to copy data from other pages). |
| Actions Column - SSH | This feature allows you to copy the SSH command and password for connecting to the relevant container. Note: This feature requires the relevant container image to have the SSH component installed. |
| Actions Column - Restart | This feature allows you to restart the current container. If individual containers fail to start, you can use this feature to restart the container after fixing the issue, without needing to restart the entire development environment. |
Performance curves can be displayed for specific container instances by selecting them from the container instance list. You can query time ranges by clicking "15 Minutes", "4 Hours", "24 Hours", or setting a custom time limit. If the node hosting the container uses IB or RoCE networks, you can filter the performance curves to display data for the corresponding network card via the "Infiniband" dialog box.
Performance curve metrics include:
| Scenario | Performance Curve Metrics |
|---|---|
| Basic Scenario | CPU utilization, Memory utilization, Network input/output, Total memory/Used memory, Disk input/output |
| GPU Scenario | Adds to Basic Scenario: Accelerator utilization, Accelerator memory utilization, Accelerator memory used, Accelerator memory unused, draw_active, fp64_active, fp32_active, fp16_active, gr_engine_active, sm_active, sm_occupancy, tensor_active, pcie_rx_bytes, pcie_tx_bytes, nvlink_rx_bytes, nvlink_tx_bytes |
| MIG Scenario | Adds to Basic Scenario: MIG memory utilization, MIG memory used, MIG memory unused, draw_active, fp64_active, fp32_active, fp16_active, gr_engine_active, sm_active, sm_occupancy, tensor_active |
| IB or RoCE Network Scenario | Adds to Basic Scenario: ib_xmitdata, ib_rcvdata, ib_xmitpktsize, ib_rcvpktsize |
Note: The following performance metrics are displayed only for GPU models that support NVIDIA DCGM Profiling Metrics: gr_engine_active, sm_active, sm_occupancy, tensor_active, dram_active, fp16_active, fp32_active, fp64_active, pcie_rx_bytes, pcie_tx_bytes, nvlink_rx_bytes, nvlink_tx_bytes
Basic Information:
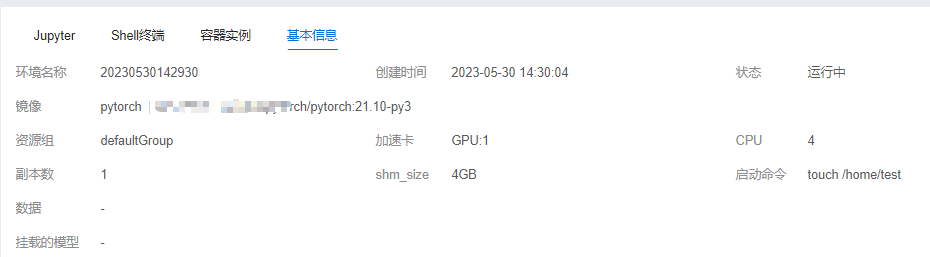
Other features include Visualization, Save Image, One-Click Submit, and Training Jobs.
| Feature | Description |
|---|---|
| Visualization | Opens a visualization environment. Currently supports TensorBoard, Visdom, and Netscope. |
| Save Image | Save all information in the current development environment as a new container image, similar to the docker commit method. |
| One-click submission | Submit a training job with one click based on the current development environment configuration. |
| Training Job | A simplified list of unfinished training jobs for the current user. |
Development Environment Operations
Users can perform operations on the development environment in the action column of the list. The following operations are currently supported:
| Feature | Description |
|---|---|
| Clone | Clone a development environment with the same configuration. |
| Start | Start a stopped development environment. |
| Stop/Resume | Users can stop a running development environment (underlying data will be deleted upon stopping). Click Resume to restart the development environment. |
| Delete | Delete the development environment. |
| Mount Dataset | Mount a dataset. |
| Resource Adjustment | Dynamically adjust resources for a running development environment and modify resource configurations. |
| Export | Export the configuration information of the current development environment. The format is one replica per line, with each line containing the pod name, node IP, and pod IP, saved to the user's home directory. |
Job Management
"Business Management > Job Management" is available when the business scope is Training/Inference or Training.
Create Training Job
This manual uses a TensorFlow single-machine job as an example. Function Description: Users can automatically create a new training job using the platform's training job feature. Upon successful creation, the job is automatically displayed in the job management list.
Operation Steps:
A: Go to "Business Management > Job Management", click the "Create" button on the page, and the task information entry page will pop up, as shown below:
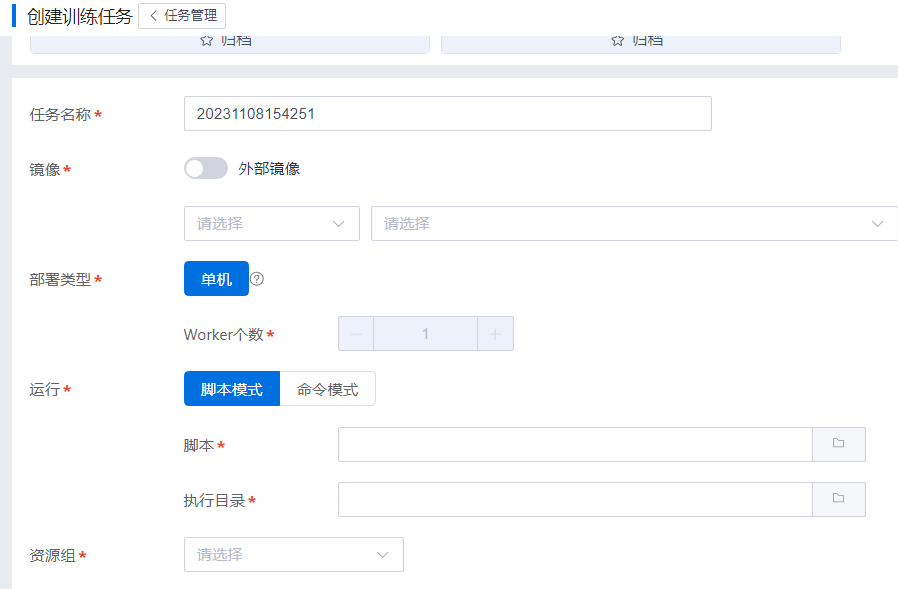
B: Fill in the detailed task information:
Name: Task name (only accepts English letters, numbers, and underscores; cannot start with an underscore).
Image: Select the TensorFlow framework name in the first window, and select the framework version in the second window.
External Image: After checking this option, users can custom-input the image name.
Deployment Type: Training job deployment type; select "Single Machine".
Resource Group: Select a resource group.
Network Type: Select the corresponding network type.
Accelerator Series: Select the corresponding accelerator series from the dropdown list; only one type can be used to submit a job; the available node information on the right will dynamically filter based on the selected accelerator series.
Accelerator Type: Select the corresponding accelerator type within the resource group.
CPU/Accelerator: Select the CPU/accelerator resource configuration plan for Worker nodes. When the quota plan is "Custom", windows for accelerators and CPUs will pop up, allowing custom resource configuration settings.
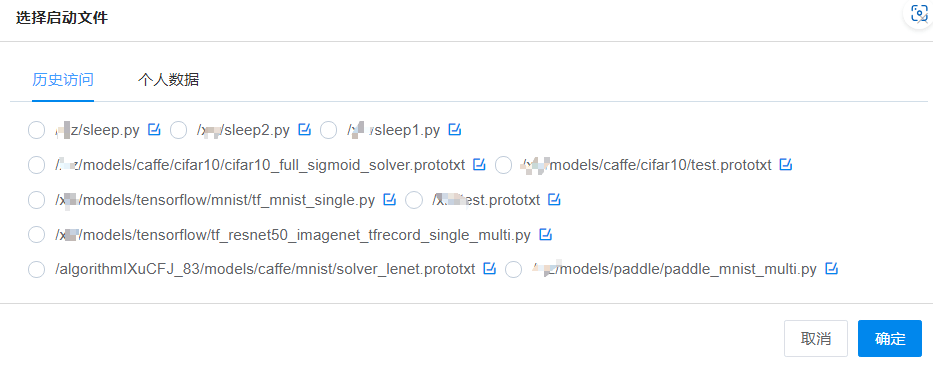
Script: Click the button after the window to pop up the "Select Startup File" window, and select the TensorFlow single-machine training script.
Script Example Path: /xlz/models/tensorflow/mnist/tf_mnist_single.py
Note: "xlz" represents the user's home directory, which ultimately depends on the actual username; click OK after selection.
The "Select Startup File" section contains two sub-options: "History" and "Personal Data". "History" displays previously used startup scripts for user selection. "Personal Data" refers to data files located in the user's directory.

Command: Clicking "Command Mode" switches to command mode, allowing users to customize their startup command.
Execution Directory: Select the directory for executing the training script. Any folder within the user's directory can be selected.
Script Parameters: Enter parameters for the Python script in the "Script Parameters" input box, for example: "--data_dir /MNIST_data --data_dir2 /MNIST_data2".
Elastic Job Configuration:

Currently, the training framework supports elastic jobs using Horovod+TensorFlow, Horovod+PyTorch, and PyTorch DDP.
Click "Elastic Job" to enable it, set "Max Workers" greater than "Min Workers", and complete the elastic job configuration.
- MPI Elastic Job: Add the command parameter: --host-discovery-script /etc/mpi/discover_hosts.sh. Example command parameters:
horovodrun --verbose -np 2 --min-np 2 --max-np 4 --blacklist-cooldown-range 120 300 --host-discovery-script /etc/mpi/discover_hosts.sh python train.py
- PyTorch Elastic Job: Example command parameters:
torchrun --nnodes=2:4 --nproc_per_node=1 --max_restarts=100 --rdzv_id=1 --rdzv_backend=c10d --rdzv_endpoint=$MASTER_ADDR":"$MASTER_PORT python train.py

Large Model Distributed Jobs:
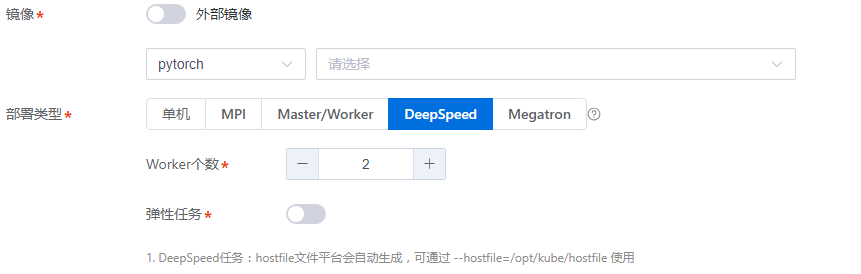
When the container image framework is set to PyTorch, the platform provides two large model frameworks: DeepSpeed and Megatron.
Under the DeepSpeed framework, the platform automatically generates a hostfile. The training script can specify the parameter --hostfile=/opt/kube/hostfile to start training.
Under the Megatron framework, the platform starts a master and the number of workers specified by page parameters, automatically setting environment variables such as MASTER_ADDR, MASTER_PORT, and RANK within the container. The training program can start training directly using these environment variables.
Data Configuration: Click "Data Configuration > Data" to access two data configuration methods:
Data - File Management
Select the dataset(s) to use in the pop-up path selection window. Multiple datasets can be selected.
Data - Dataset Management
Select an available dataset from the dataset list. Only one dataset can be selected.
Update Dataset Description: When checked, the platform automatically identifies cached datasets. If some dataset files have changed, the platform performs an incremental update. If the dataset is not cached, it is fully downloaded. Updates cannot be performed if the cached dataset is currently in use.
Dataset Usage Method Description: Two methods are available: "Node Cache" and "Direct Use". "Node Cache" caches the dataset to the node, while "Direct Use" uses the dataset from shared storage.
Note: Datasets can also originate from the user directory or public directories (global shared and group shared). Multiple datasets can be selected. Example dataset path: /MNIST_data
Unzip Dataset Description: Only the Node Cache method supports unzipping. Recursive unzipping is supported. Supported archive types: tar, tar.gz, zip, gz, tar.bz2. The extraction directory is at the same level as the archive directory and has the same name. Unzipping supports single dataset operations.
Select Model: Users can select the model to be mounted.
Environment Variables: Users can add custom environment variables.
More Configuration:
| Feature | Description |
|---|---|
| Scheduling Policy | Configure the scheduling policy. Currently supported policies are spread (default) and bestfit. |
| Ports | Provides service port access capabilities. Service ports within the container are automatically mapped to host ports. Multiple ports can be configured, separated by semicolons (in English mode). The first port has fault tolerance capabilities, while other ports only provide service functionality. After configuration, the corresponding port information can be viewed in the instance list. |
| Memory | Configure the memory required for training job worker nodes. Setting this to 0 indicates no limit (must be less than the remaining memory on the host where the worker resides). |
| Log Path | Output path for training logs. Click the button after the window, select the corresponding path, and click "OK". |
| Directory Mount | Public directories available for mounting. |
| shm_size | Container shm_size parameter, default is 4GB. |
The right area displays node information under the resource group. Users can customize the running nodes here. For example, to run the task on ainode53, simply check the box, and the platform will schedule the task to that node by default. The node list also shows resource status for each node. If no nodes are selected, the platform automatically selects nodes with sufficient remaining resources to run the task.
C: After filling in the information, click the "OK" button to create the task. The task will appear in the task management list.
Stop Training Job
Function Description: Users can stop a running training job using the platform's stop training job feature. This operation is not supported for workflow-related tasks.
Operation Steps:
A: Navigate to "Business Management > Task Management", select a running training job, and click the "Stop" button.
B: The page displays a success message indicating the operation was successful.
Start Training Job
Description: Users can start a stopped training job using the platform's start training job feature. This operation is not supported for workflow-related tasks.
Operation Steps:
A: Navigate to "Business Management > Task Management", select a stopped training job, and click the "Start" button.
B: The task restarts, indicating the operation was successful.
Resubmit Training Job
Description: Users can resubmit a training job using the platform's resubmit training job feature. This operation is not supported for workflow-related tasks.
Operation Steps:
A: Navigate to "Business Management > Task Management", select a training job, and click the "Resubmit" button.
Submit Training Job via History
Description: Users can submit a training job using the platform's submit via history feature.
Operation Steps:
A: Navigate to "Business Management > Task Management", click the "Create" button to enter the task information form, as shown below: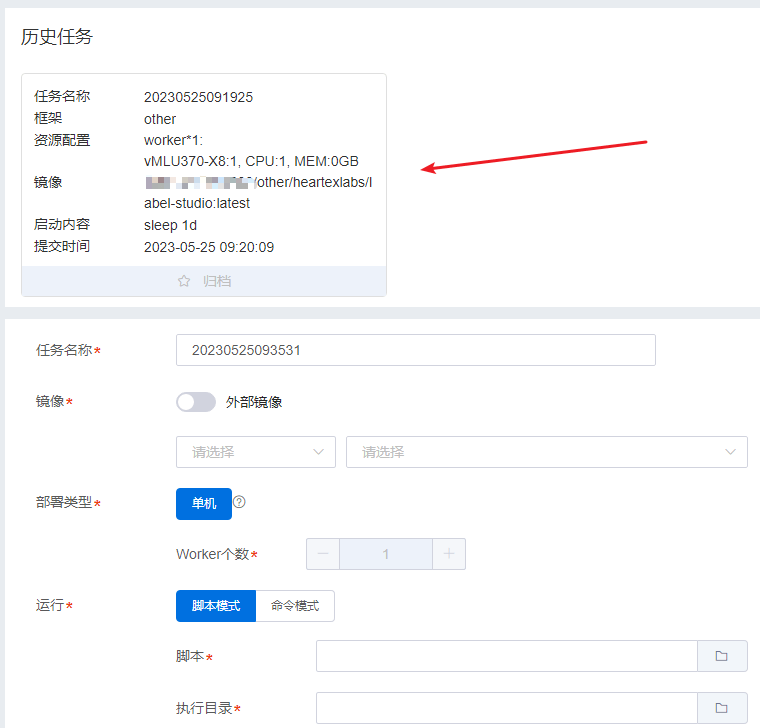
B: Historical tasks can be archived and unarchived; archived tasks are displayed with higher priority.
C: After selecting the corresponding historical task, clicking will automatically populate the historical task information: framework type, container image, accelerator, CPU, memory, startup file, dataset, etc.
Delete Training Job
Description: Users can delete a training job using the platform's delete training job feature. This operation is not supported for workflow-related tasks.
Operation Steps:
A: Navigate to "Business Management > Task Management", select a training job, and click the "Delete" button.
B: The page displays a success message indicating the operation was successful.
Filter Non-Terminated Tasks
Description: Users can filter non-terminated tasks using the filter feature.
Operation Steps:
A: Navigate to "Business Management > Task Management", click the "Task Management" list, and use the filter feature to filter.
Filter Terminated Tasks
Description: Users can filter terminated tasks using the filter feature.
Operation Steps:
A: Navigate to "Business Management > Task Management", click the "Terminated Tasks" list, and use the filter feature to filter.
View Training Logs
Description: Users can view specific training logs using the platform's view task logs feature.
Operation Steps:
A: Navigate to "Business Management > Task Management", click the task name to jump to the task details page, and click the "Task Logs" button to view training logs.
View Container Instances
Description: Users can view task container instance information and monitoring information using the platform's view task container instances feature.
Operation Steps:
A: Navigate to "Business Management > Task Management", click the task name to jump to the task details page, and click the "Container Instances" button to view container instance information, as shown below:
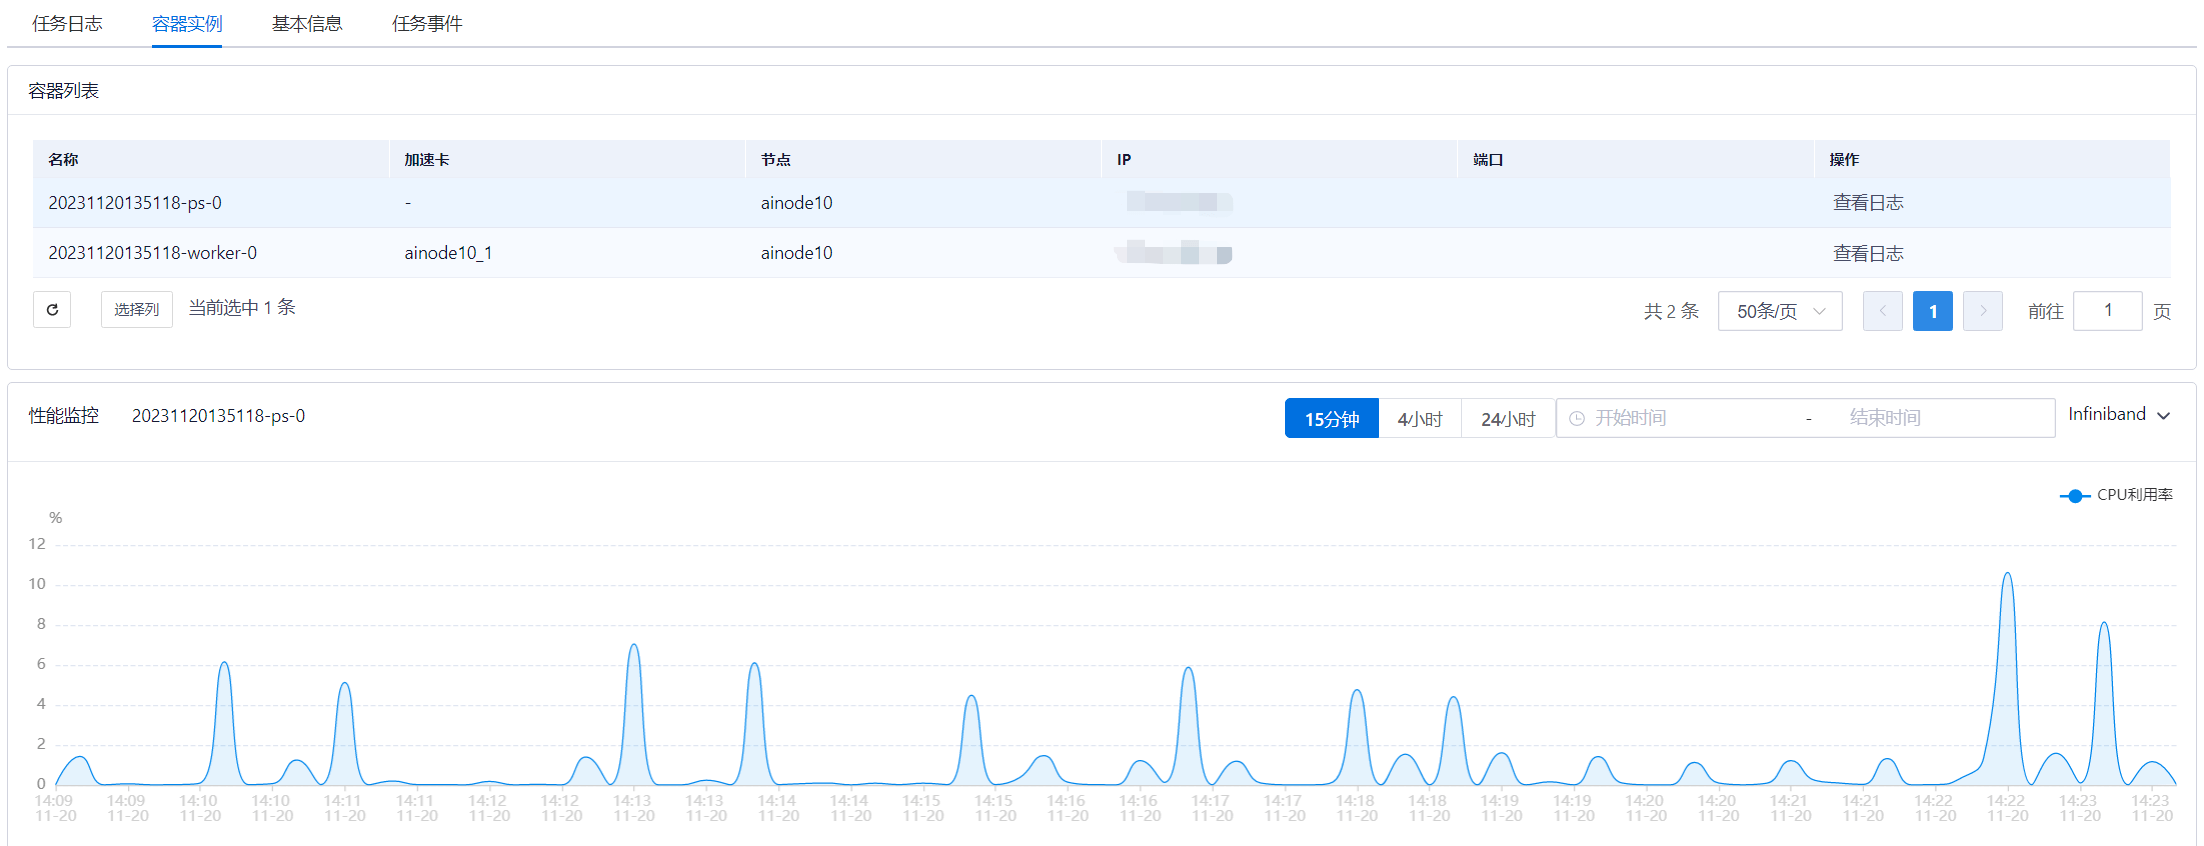
The container instance list includes: Name, Status, Accelerator, Node, IP, Port, and Actions columns.
Performance curves can be displayed for specific container instances by selecting them from the container instance list. You can query time ranges by clicking "15 Minutes", "4 Hours", "24 Hours", or setting a custom time limit. If the node hosting the container uses IB or RoCE networks, you can filter the performance curves to display data for the corresponding network card via the "Infiniband" dialog box.
Performance curve metrics include:
| Scenario | Performance Curve Metrics |
|---|---|
| Basic Scenario | CPU utilization, Memory utilization, Network input/output, Total memory/Used memory, Disk input/output |
| GPU Scenario | Adds to Basic Scenario: Accelerator utilization, Accelerator memory utilization, Accelerator memory used, Accelerator memory unused, draw_active, fp64_active, fp32_active, fp16_active, gr_engine_active, sm_active, sm_occupancy, tensor_active, pcie_rx_bytes, pcie_tx_bytes, nvlink_rx_bytes, nvlink_tx_bytes |
| MIG Scenario | Adds to Basic Scenario: MIG memory utilization, MIG memory used, MIG memory unused, draw_active, fp64_active, fp32_active, fp16_active, gr_engine_active, sm_active, sm_occupancy, tensor_active |
| IB or RoCE Network Scenario | Adds to Basic Scenario: ib_xmitdata, ib_rcvdata, ib_xmitpktsize, ib_rcvpktsize |
Note: The following performance metrics are displayed only for GPU models that support NVIDIA DCGM Profiling Metrics: gr_engine_active, sm_active, sm_occupancy, tensor_active, dram_active, fp16_active, fp32_active, fp64_active, pcie_rx_bytes, pcie_tx_bytes, nvlink_rx_bytes, nvlink_tx_bytes
View Task Basic Information
Description: Users can view task basic information using the platform's view task basic information feature.
Operation Steps:
A: Navigate to "Business Management > Task Management", click the task name to jump to the task details page, and click the "Basic Information" button to view task basic information.
Task Visualization
Description: Users can view task training logs using the platform's visualization feature.
Operation Steps:
A: Navigate to "Business Management > Task Management", and in the task list's action column, click the "Visualization" button.
B: If no log path was selected when creating the task, the user will be prompted to select one here.
C: After clicking "OK", the visualization window pops up.
Submit Urgent Job
If the user has permission to submit urgent jobs, a toggle for urgent jobs is visible when clicking the "Create" button to create a task.

Enable the emergency job switch, click the "OK" button, and submit an emergency job.
Algorithm Management
"Business Management > Algorithm Management", available when the business scope is Training/Inference or Training
Create Algorithm
Click "Create" or "Create Version" to enter the Create Algorithm or Create Version page. Fill in the relevant algorithm information as needed.
On the Create Algorithm page, you can customize the algorithm name and version. On the Create Version page, the algorithm name cannot be customized. The container image can be a platform image or an external image. In script mode, select the algorithm execution script and execution directory from your personal directory, ensuring the execution script is within the execution directory. In command mode, enter the execution command. Runtime parameters are the parameters required for executing the script or command. Environment variables are those required for the algorithm job. Optionally specify the number of CPU and accelerator resources needed. Deployment type is selected automatically based on the container image framework type. Select a model as needed.
Supported deployment types:
| Deployment Type | Framework |
|---|---|
| Single-node (Worker: 1) | All frameworks |
| PS/Worker(PS:1-1000,Worker:1-1500) | tensorflow |
| MPI(Worker:2-1500) | Non-PaddlePaddle frameworks |
| Master/Worker(Master:1,Worker:1-1500) | pytorch |
| Server/Worker(Server:1-1000,Worker:1-1500) | mxnet |
| collective:(Worker:2-1500) | paddlepaddle |
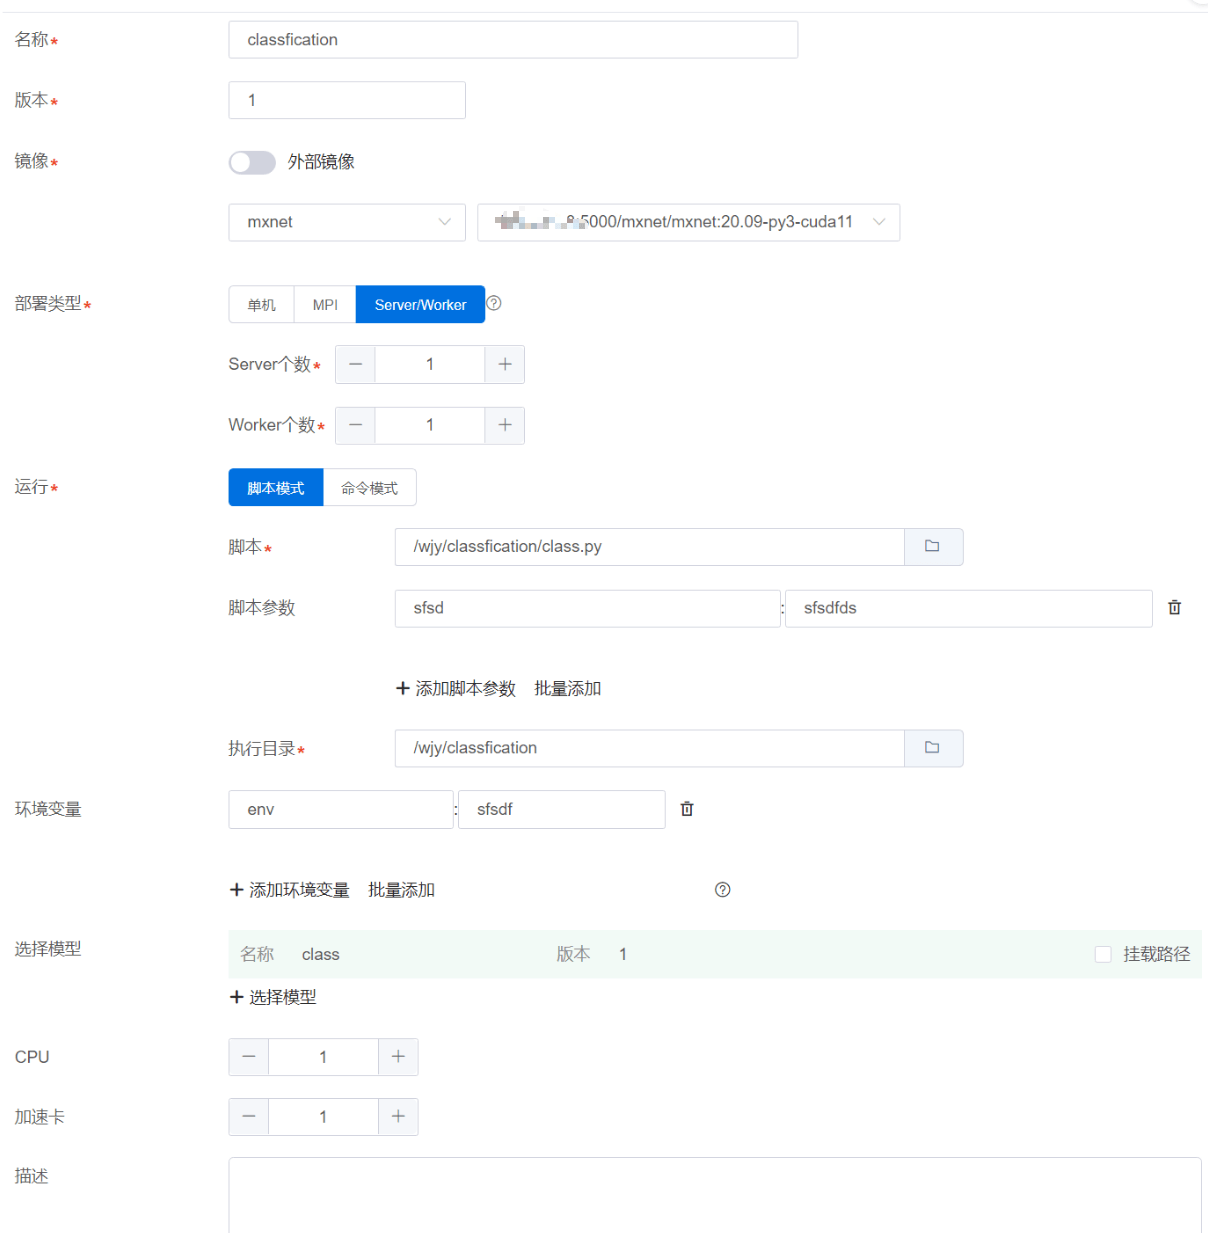
On the Create Algorithm page, users can quickly create an algorithm using a published one. Click the corresponding published algorithm to auto-fill the creation information, which can then be modified as needed. In script mode, if the user does not manually select the script and directory, the platform copies the published algorithm directory to the user's personal directory, naming it with the created algorithm name and version. If the user selects manually, no copy is performed, and the user's selection prevails.
Elastic Job Configuration:

For specific operation configuration, refer to "Job Management > Create Training Job > Elastic Job Configuration".
Edit Algorithm
Click the "Edit" button to enter the Edit Algorithm interface. Except for the algorithm name and version, you can modify the relevant information as needed.
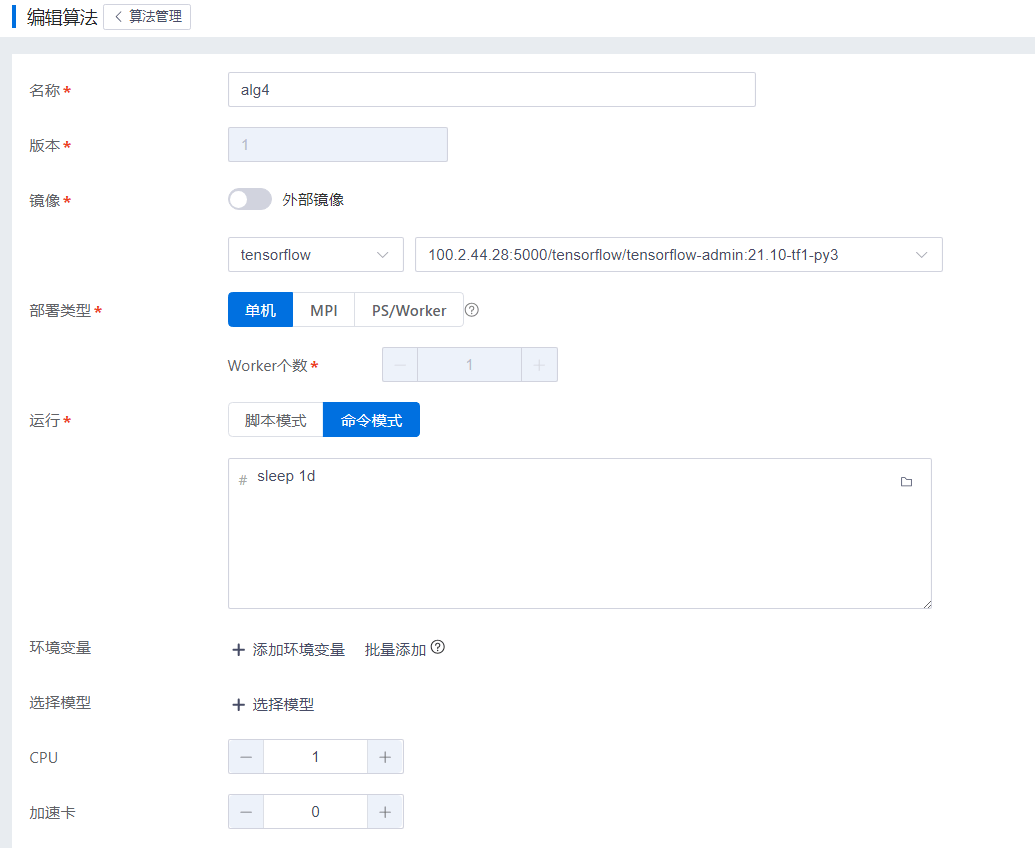
Algorithm List
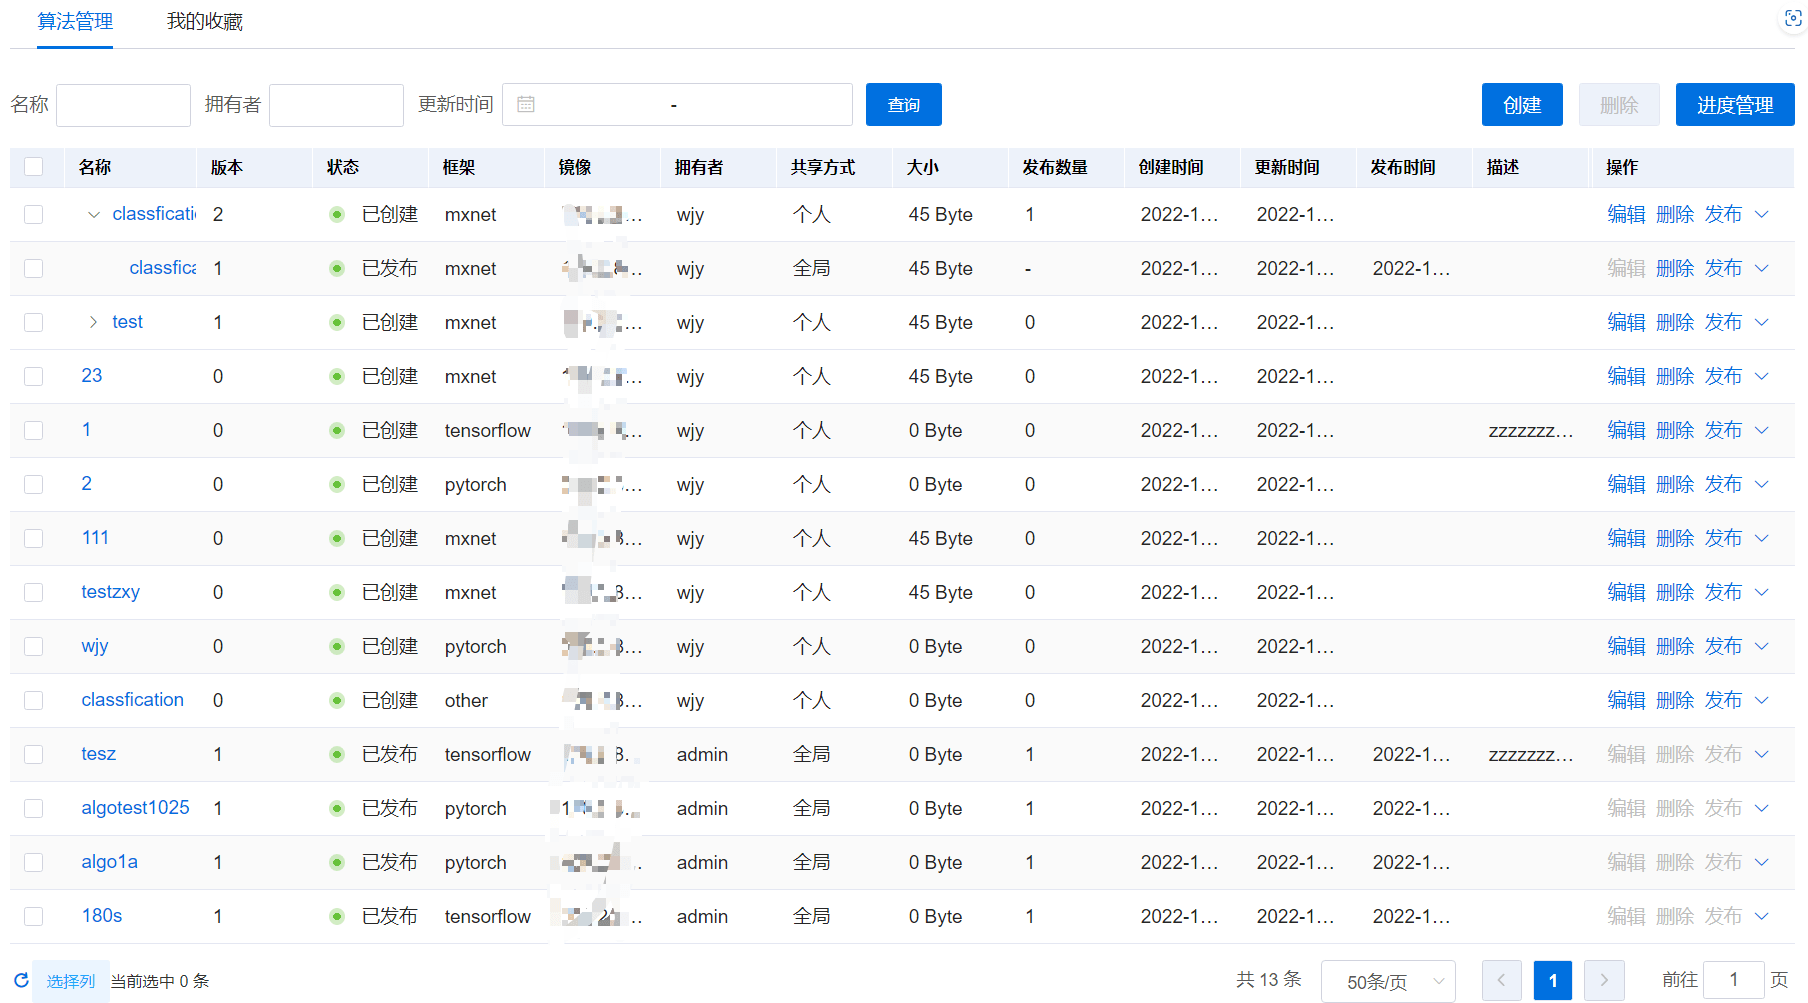
Click "Algorithm Management" to display the main algorithm information list. Algorithms with the same name are displayed in a master-detail list, with the main list prioritizing the latest algorithm information and the detail list showing the latest 10 entries. Users can view global, group, and personal algorithm information. The main list's action column includes functions such as Edit, Delete, Train, Publish Management, Publish, Create Version, and Favorite.
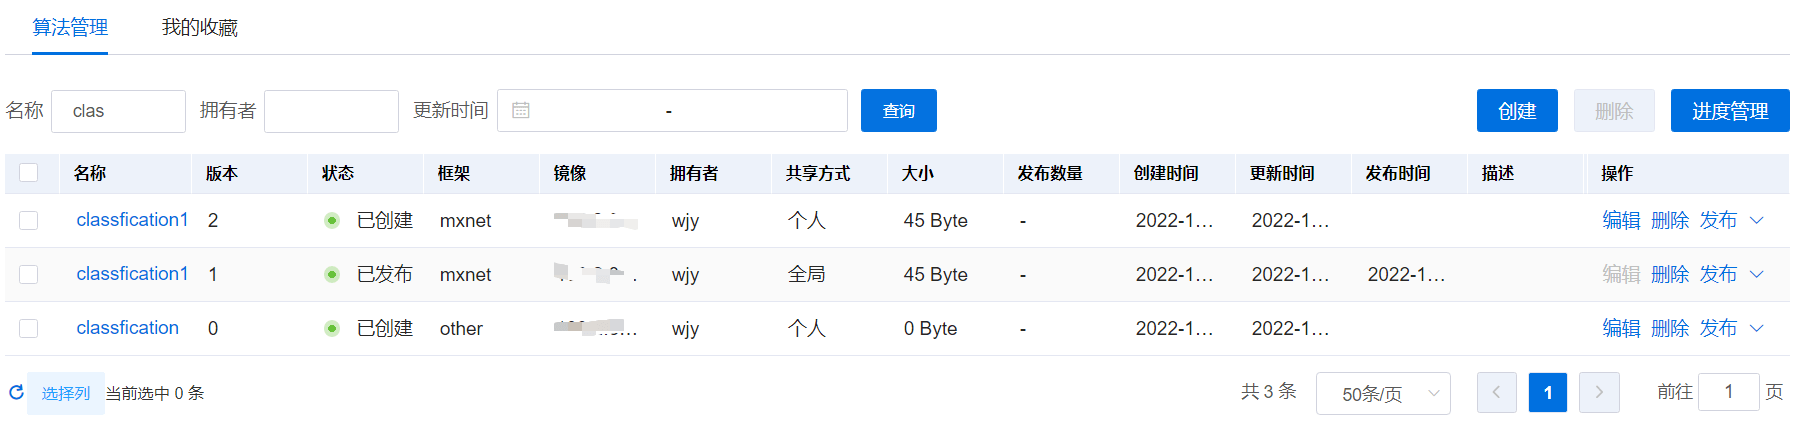
Users can query algorithm information based on conditions, including: algorithm name or description, algorithm owner, and update time range. Query results are displayed in paginated format rather than a master-detail list.
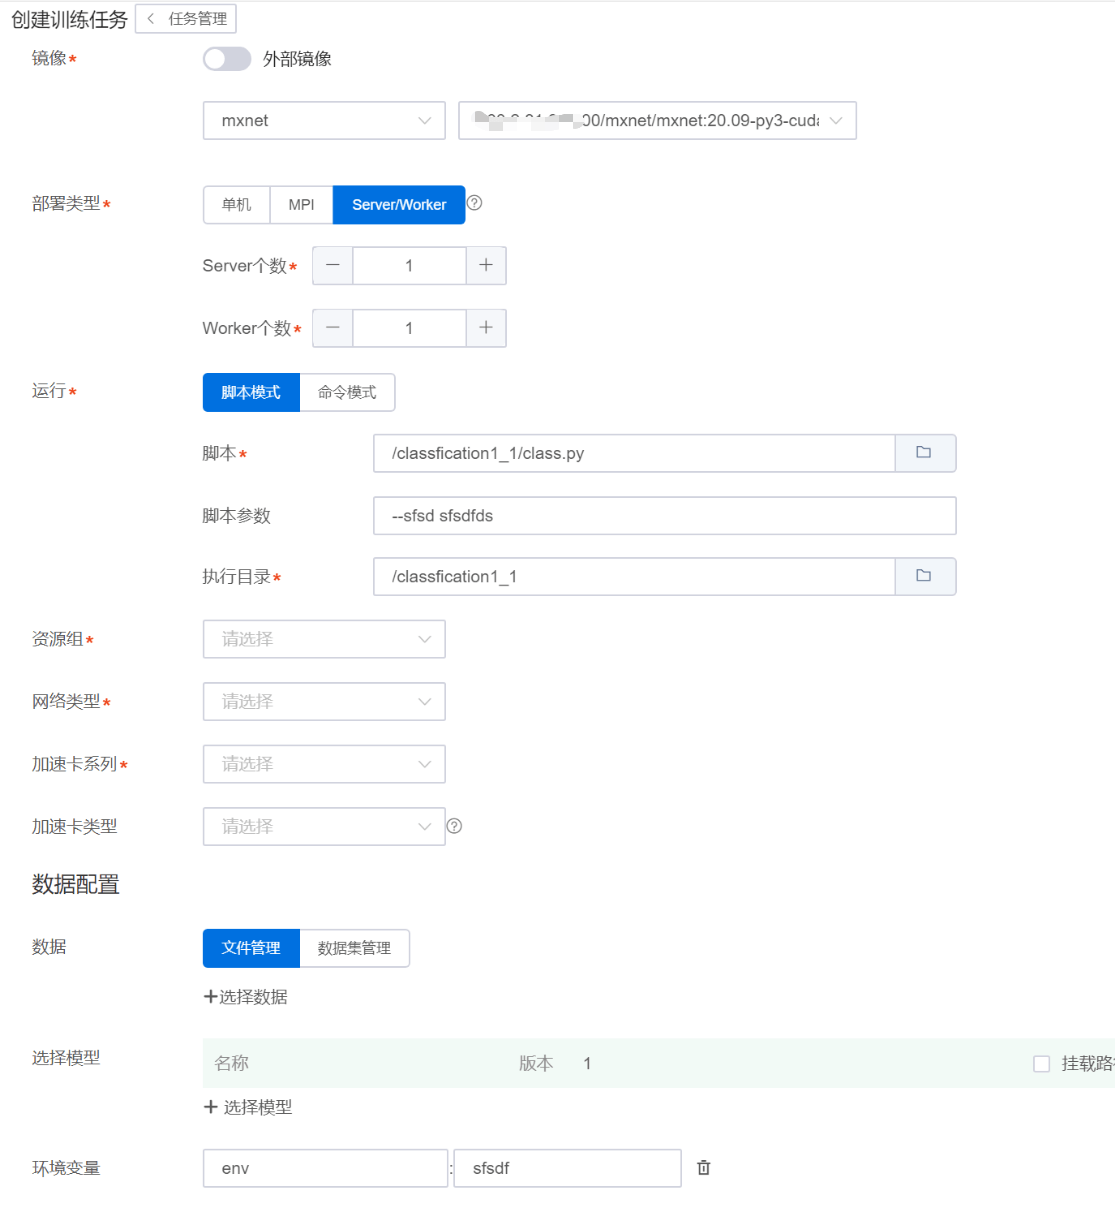
Algorithm Training
Click the "Train" button to jump to the Create Training Job interface, automatically filling in the relevant algorithm information.
Publish Algorithm
Click the Publish button to publish the algorithm. You can publish it to Personal, Group, or Global scope. Publishing to a Group makes it visible only to group members; publishing to Global makes it visible to all users. Upon successful publication, the algorithm status changes to Published.

Algorithm Publish Management
Click the Publish Management button or the algorithm name to enter the "Publish Interface > Basic Information" page, where you can view detailed algorithm information. Click the version dropdown list to view details of algorithms with the same name but different versions.
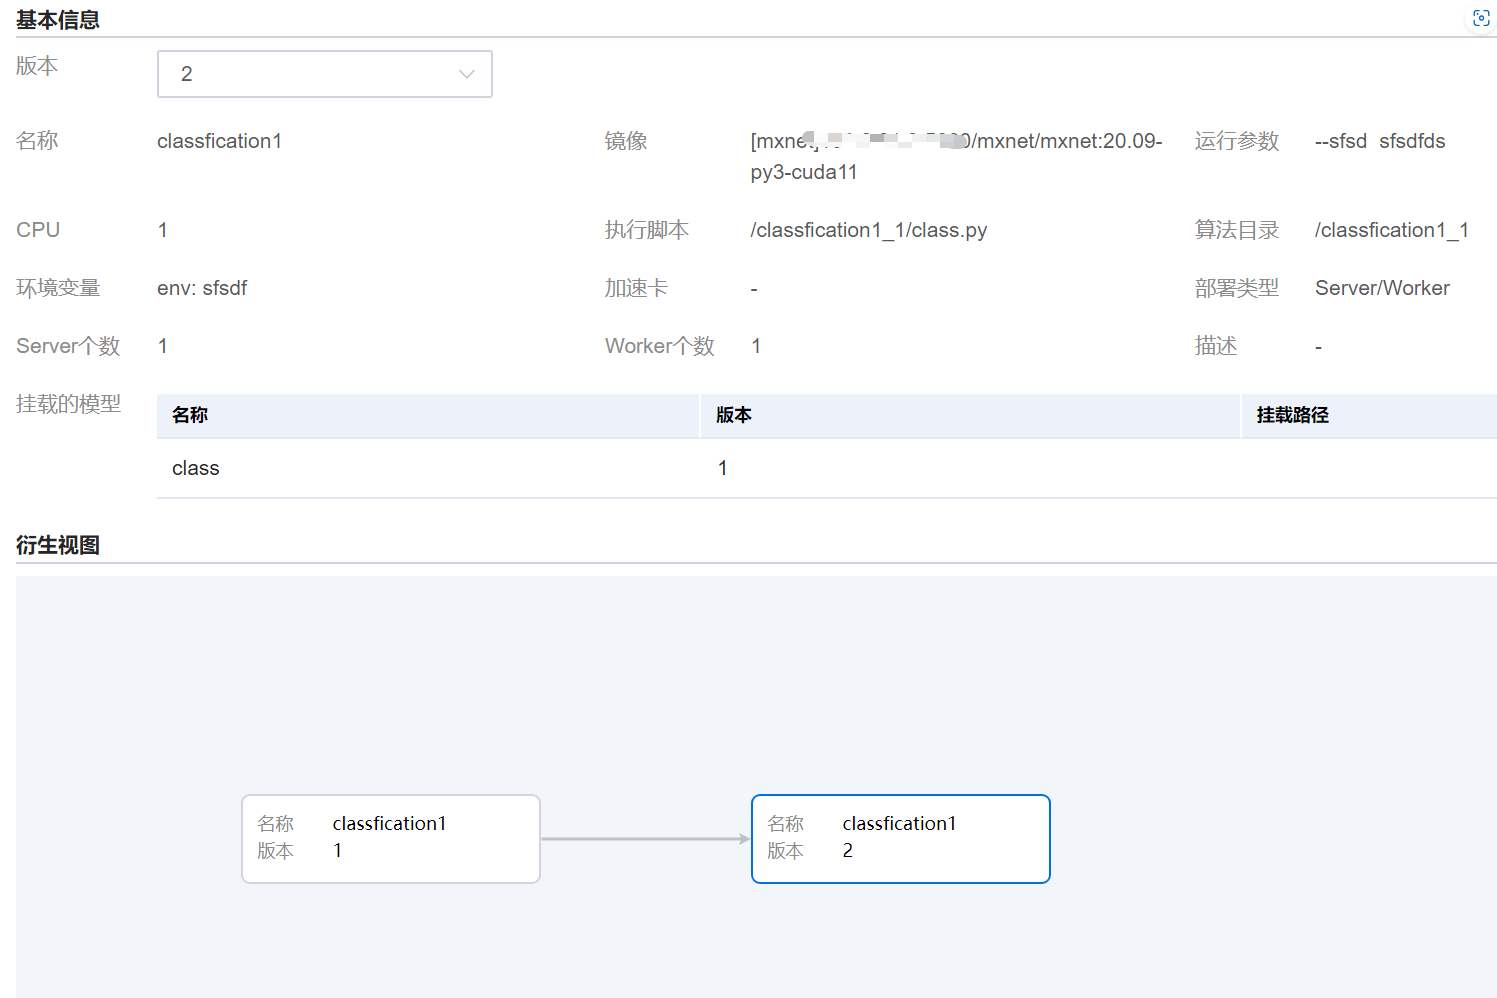
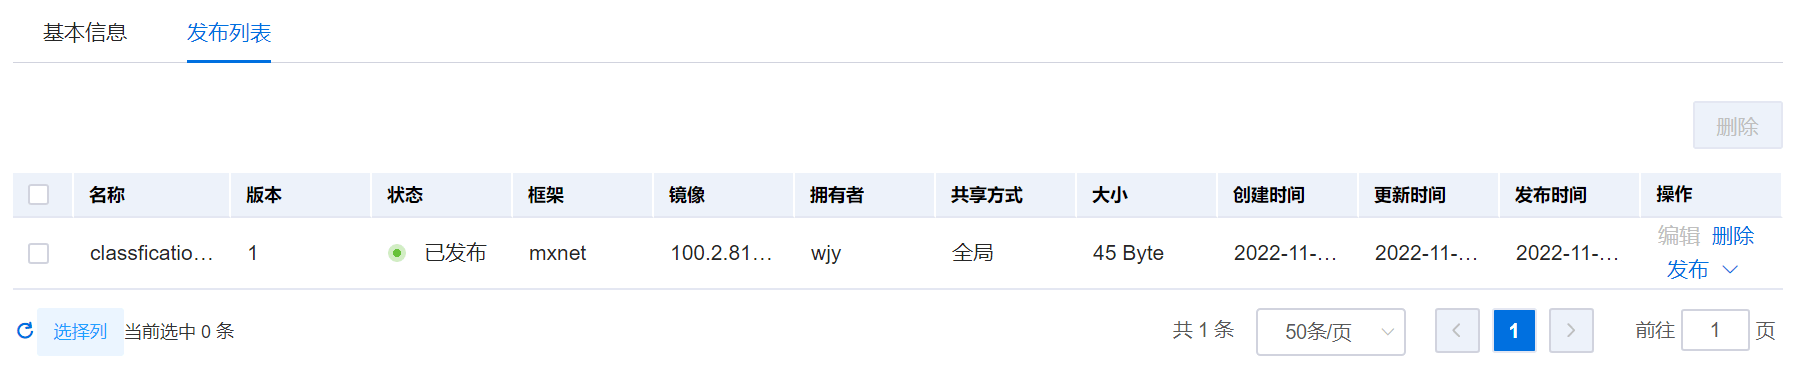
On the Publish Interface, click the Publish List to view the published list of algorithms with the same name. The list actions include: Edit, Delete, Train, and Publish.
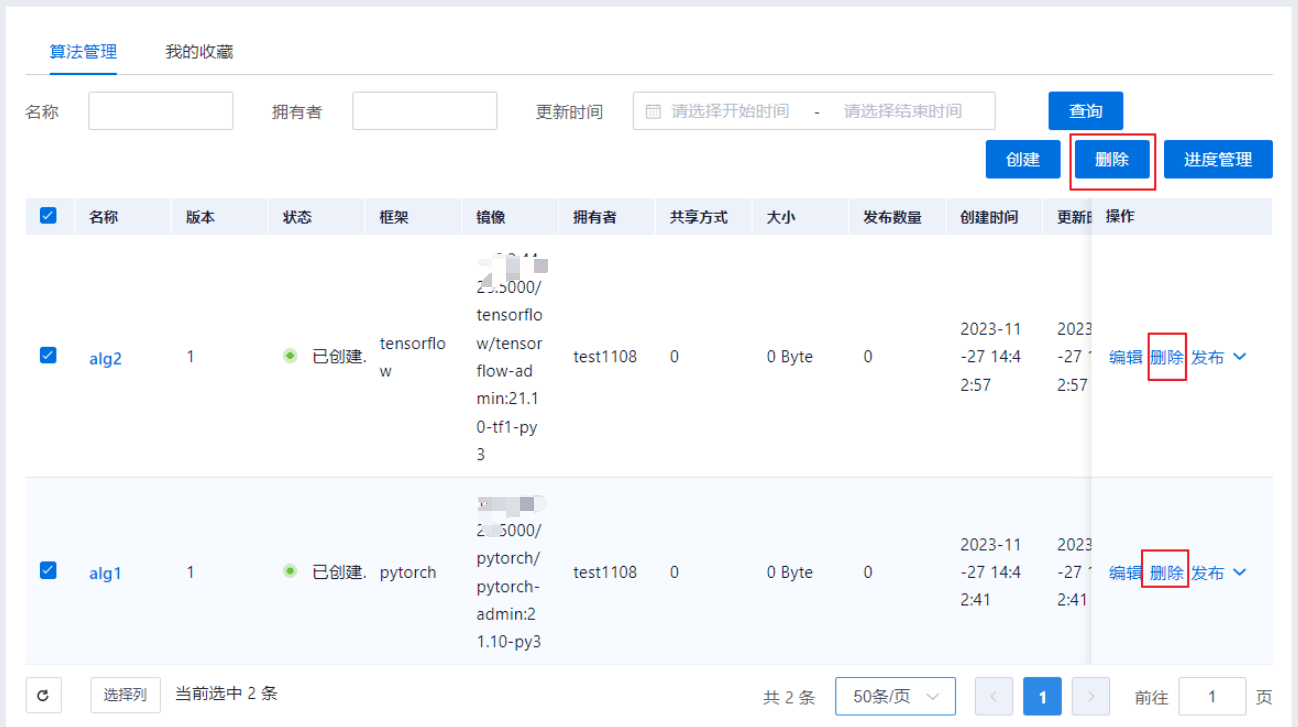
Delete Algorithm
Users can delete algorithms that meet the criteria. Unpublished algorithms support batch deletion; published algorithms do not.
Progress Management
The progress list maintains progress information for algorithm-related functional operations. Some operation scenarios do not involve progress management, such as creating an algorithm in command mode, which has no progress list. The progress list primarily targets scenarios involving algorithm directory operations.
| Operation Type | Scenario |
|---|---|
| Operation Type "Create" | Published > Create Algorithm. |
| Operation Type "Edit" | Published > Create > Create Failed; Created > Publish > Publish Failed. |
| Operation Type "Publish" | Created > Publish; Created > Publish > Publish Failed > Publish. |
| Operation Type "Delete" | Published > Delete. |
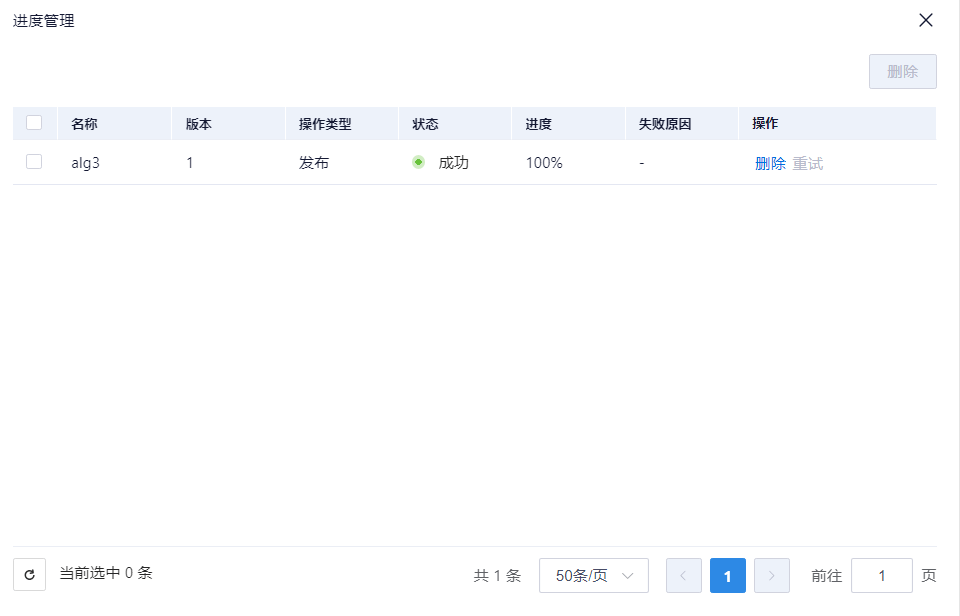
Retry on Failure
Progress management list, operation types: create, edit, and publish failed progress. If the status is failed, you can retry the failure and perform the operation again.
Algorithm favorites and unfavorites
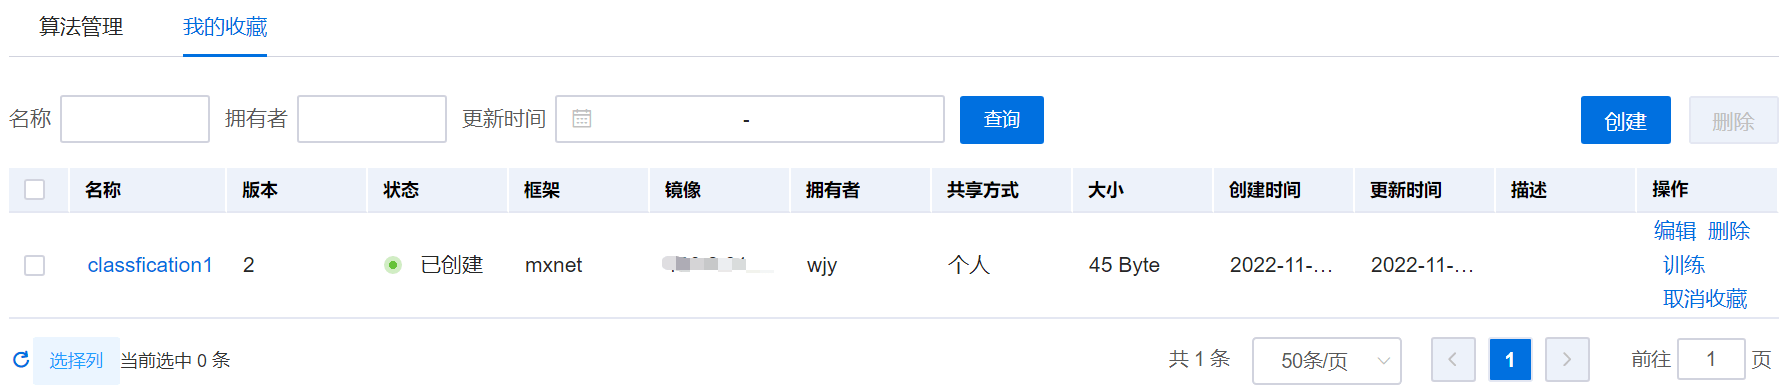
Users can favorite algorithms, view favorited algorithms in "My Favorites", and unfavorite algorithms.
Workflow management
"Business Management > Workflow Management" is available when the business scope is training and inference or training.
Create workflow
Users click "Create" to enter the workflow creation page. Users can fill in workflow information as needed. The main steps for creating a workflow are:
- Basic information
|Field |Description | | ---- | ---- | |Name |Workflow name, globally unique | |Scheduled execution |Whether to enable scheduled execution. If enabled, the execution cycle can be configured by year, month, week, day, or custom cron. | |Run immediately |Whether to enable immediate execution upon successful workflow creation. If enabled, the workflow will be triggered to run immediately after successful creation. | |Description |Workflow description ||

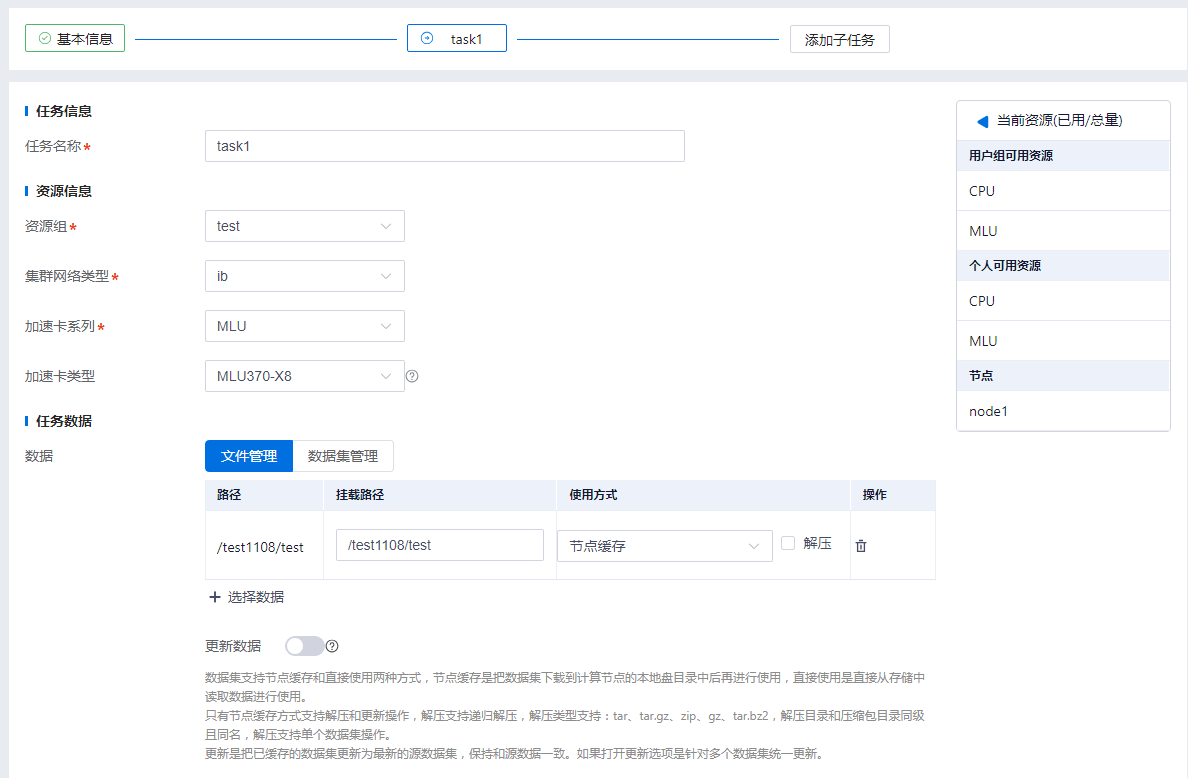
2. Subtasks (supports multiple subtasks)
| Field | Description |
|---|---|
| Task information | Includes the "Task Name" field, which is the name of the workflow subtask. |
| Resource information | Resource configuration for workflow subtasks, including "Resource Group", "Cluster Network Type", "Accelerator Series", and "Accelerator Type". |
| Task data | Data configuration for workflow subtasks, including "Data" information. Users can select the dataset information required by the subtask. |
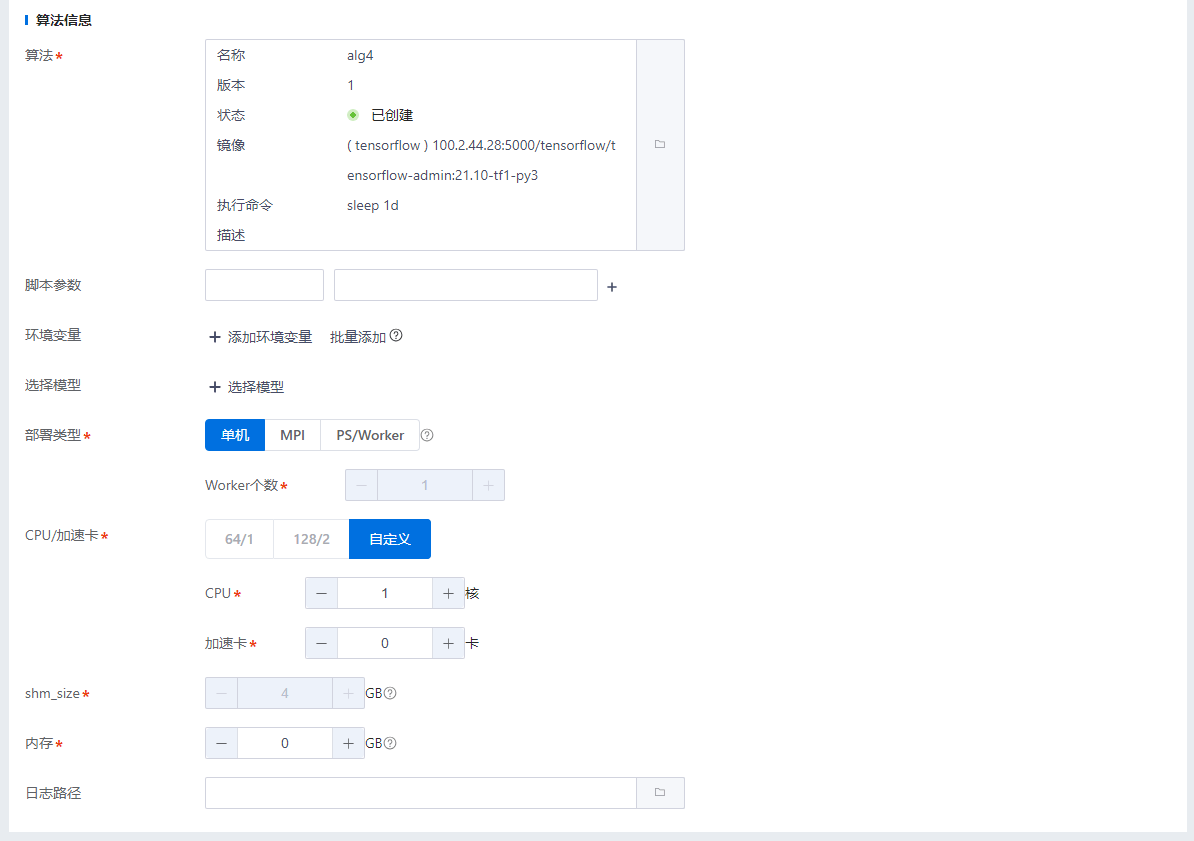
| Algorithm information | Algorithm configuration used by workflow subtasks. After selecting the corresponding algorithm, users can modify the configuration information brought in by the algorithm, including script parameters, environment variables, deployment type, CPU/accelerator, and other configurations. |
Run workflow

Workflow startup methods:
- Run immediately: If set to run immediately during workflow creation and editing, the workflow will automatically run immediately after the workflow configuration is completed.
- Non-immediate execution: After the workflow is created, manually click the "Run" button in the operation column of the workflow list.
- Scheduled execution: Set during workflow creation and editing, or enable scheduled execution by selecting it above the workflow list.
Stop/start workflow

Users can stop workflows that are running but not yet completed. After stopping, the workflow tasks and subtasks will stop, and periodic scheduling will no longer be executed.
Users can start stopped workflows.
Edit workflow

Edit workflows that meet the status conditions. Some information cannot be modified, such as the workflow name.
Delete workflow
Delete workflows that meet the status conditions.
View workflow information
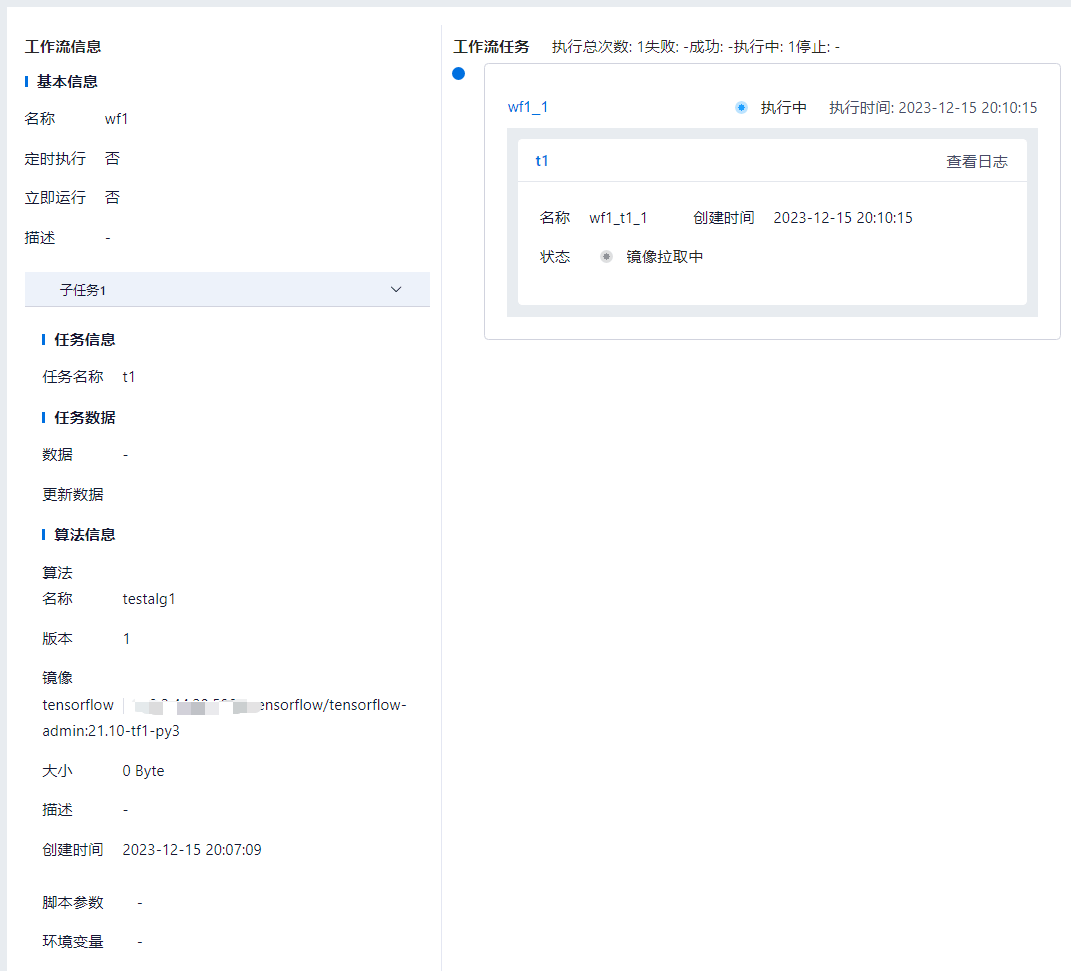
Users can select a workflow from the list, click the workflow name to enter the workflow details page, and view the basic information, subtasks, and workflow tasks.
Model management
"Business Management > Model Management" is available when the business scope is set to Training + Inference or Training.
The platform provides unified model management capabilities, centrally managing models obtained from training jobs, models developed locally by users, and models output from external platforms. Model management offers a unified import entry point, facilitating the import of local and external models into the system. It includes a test initiation feature for model testing, providing detailed log information during the process. Upon completion, a unified model publishing feature prepares the model for deployment.
Import Model
After a training job completes, the platform automatically saves the model files to the user's home directory, allowing for easy import into model management.
Click "Model Management > Import" to enter the import interface. The following information is required to import a model:
| Name | Description |
|---|---|
| Name | Model name (required). Accepts only Chinese characters, English letters, numbers, and underscores. Cannot start with an underscore. |
| Version | Model version (required). Must be an integer. |
| Scenario | Model scenario (required). Custom input. |
| Data | Records the data used by the model (optional). |
| Container Image | Records the container image used by the model (optional). |
| Script | Records the script used by the model (optional). Only script files ending in .py or .prototxt can be selected. |
| Model File | The model file to import (required). Select a model file from the user's home directory. Only a single non-empty directory can be selected. |
| Description | Model description (optional). |
| Parameter Information | Model parameters (optional). Input as key-value pairs. Batch input is supported. |
| Model Metrics | Model metrics (optional). Custom input. |
In this example, the user selects the model file obtained from the current training job.

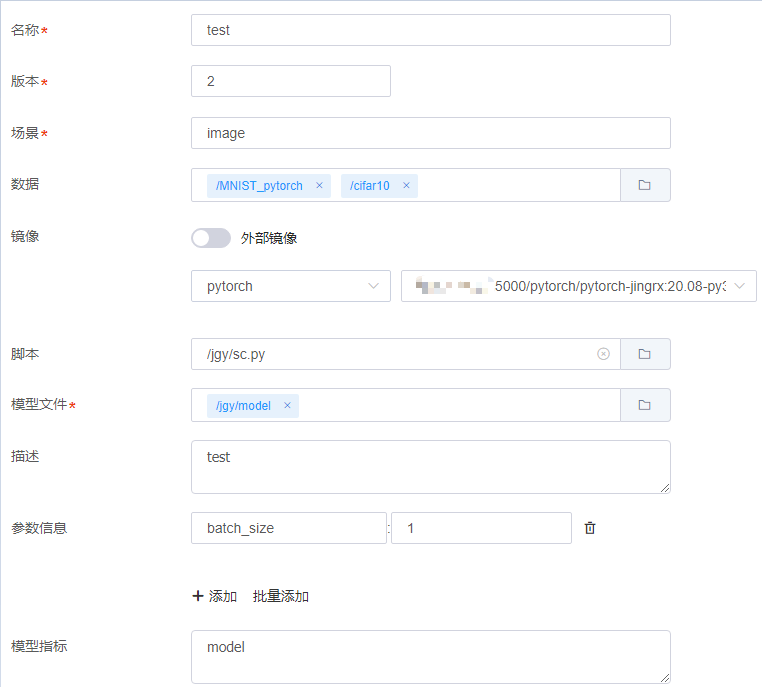
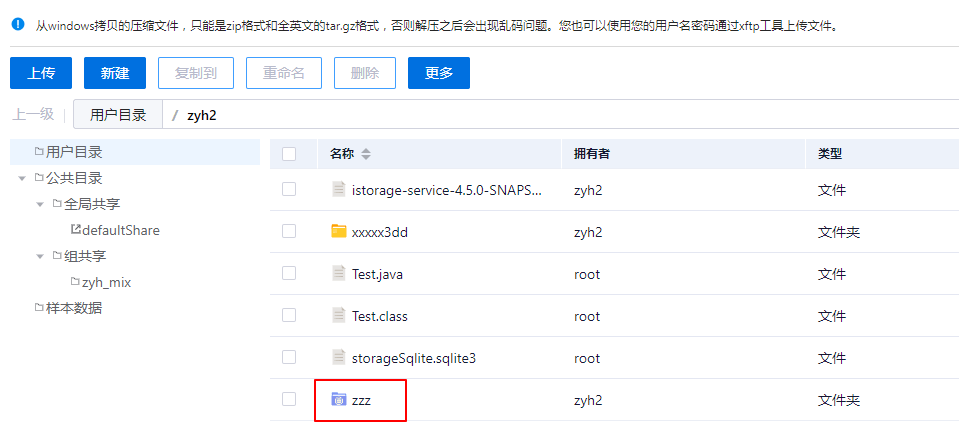
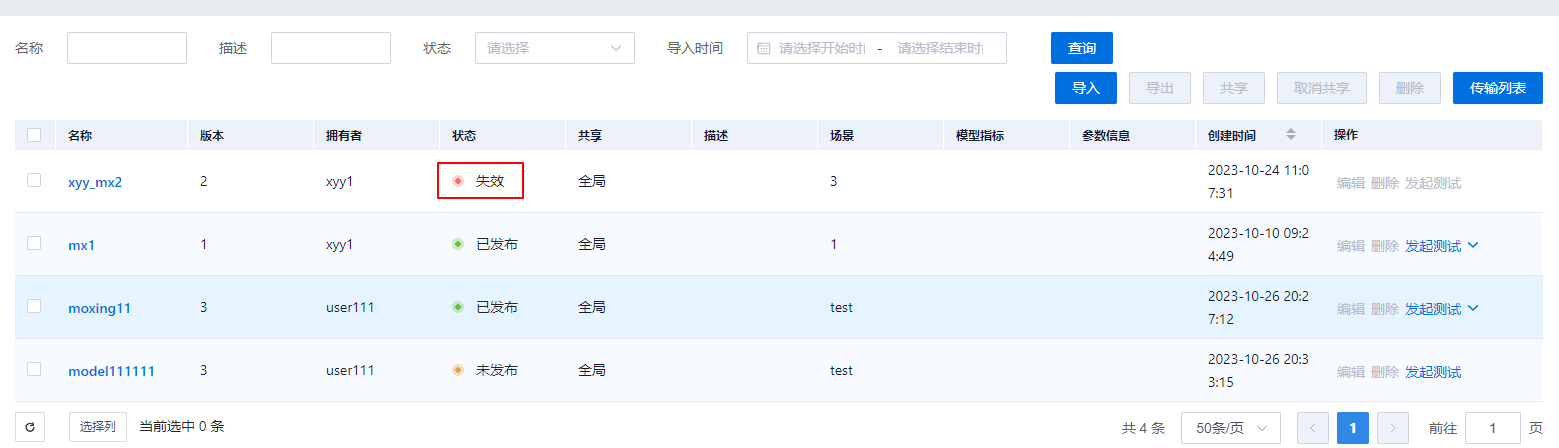
After clicking "OK", the model is imported into model management. The model file displays a shared icon in file management to distinguish it from regular files. If the model file is deleted in file management, the model status will change to invalid after a 5-minute delay.
Share Model
Model sharing attributes include three types: Private, Group, and Global.
Regular users click "Model Management" to share private models and models within their group.
Select the models to share and click the "Share" button in the upper right corner. Batch operations are supported.


Unshare Model
The unshare operation is the inverse of the model share operation.
Regular users click "Model Management" to unshare models they have shared to their group or globally. Batch operations are supported.

Delete Model
Regular users click "Model Management" to delete models where they are the owner. Batch operations are supported.

Export Model
In "Model Management", regular users select the model to export, click the Export button, and specify a custom name for the tar package in the pop-up dialog. The model tar package is exported to the user's home directory.



Model Testing
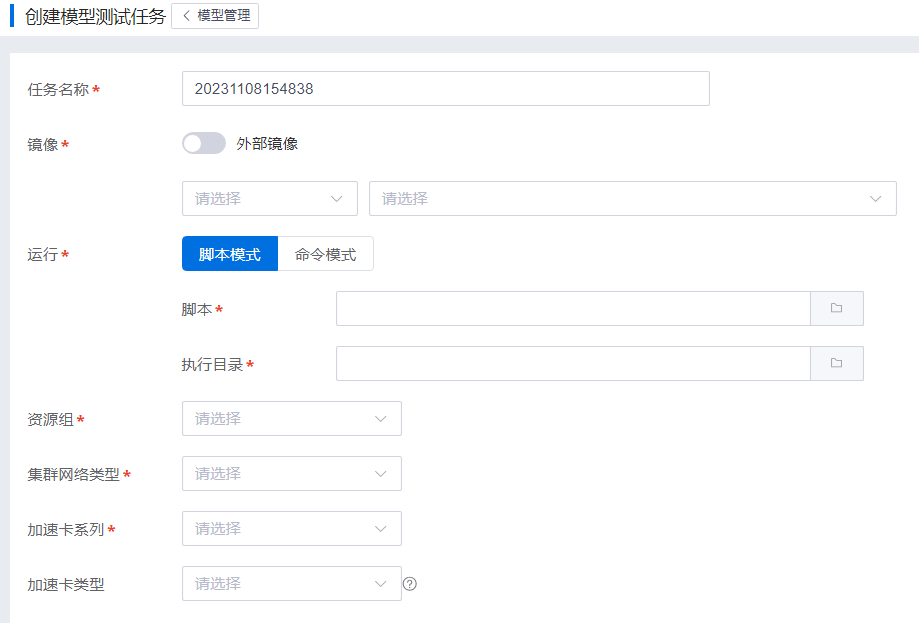
Users select a model to initiate testing, creating a model testing job.

Publish Model
Regular users do not have publishing permissions by default. Administrators must enable model publishing and grant the user publishing permissions via the User Management interface by clicking "User Management > Users > Quota and Permission Information > Adjust Permissions".
After authorization, the standard user must log in again. Click "Model Management", select the model to be published, and click the Publish button.

If the top of the page displays "This operation requires administrator approval; results can be viewed in Approval Management", an administrator must approve the request. If approved, the model is published normally; if rejected, no further publishing actions are taken.

Import Application
Published models can be imported into applications.

For training-inference integration scenarios where the user's business scope includes both training and inference, the system automatically redirects to the Application Store's Import Application page, automatically populating the model token into the input field.
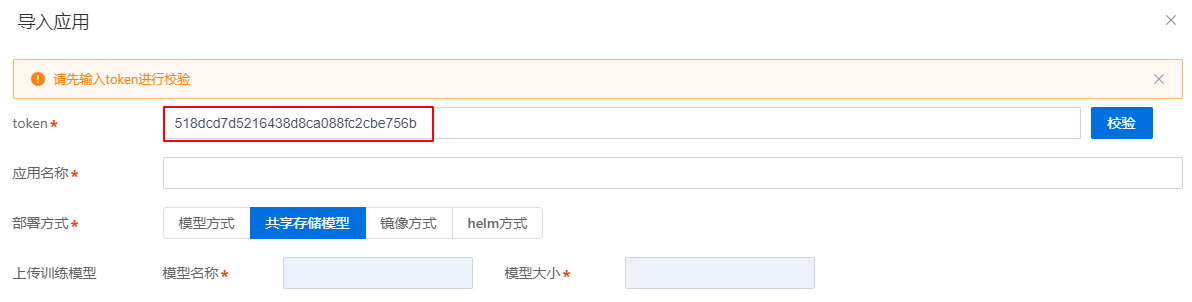
For other scenarios, clicking Import Application displays a dialog box showing the token value.

Model Transfer List
To access the transfer list, export the model. Export operations by the same user are queued.
For large model files, the operation progress is displayed. Completed, failed, or queued items can be deleted individually by clicking the "Delete" button. In-progress items cannot be deleted.
Model List
The model list can be queried by name, description, status, and import time.
| Query Conditions | Description |
|---|---|
| Name | Full Fuzzy Query |
| Description | Full Fuzzy Query |
| Status | Select the exact model status from the dropdown menu. |
| Import Time | Select a start and end time to query. |
The model list columns include: Name, Version, Owner, Status, Shared, Description, Scenario, Model Metrics, Parameter Information, Creation Time, and Actions. The list can be sorted in ascending or descending order by creation time.

Models with the same name but different versions are displayed in a collapsed view.

Edit Model
Select a model from the list, click the Edit button, enter the updated model information, and click OK.
